Differential regulation of hair cell actin cytoskeleton mediated by SRF and MRTFB
- Department of Otolaryngology-Head and Neck Surgery, Shanghai Jiao Tong University, China
- Department of Neuroscience, University of Virginia, United States
Figures
Figure 1 with 1 supplement

Srf cKO mice have defects in the cuticular plate.
(A) Reduced phalloidin staining in the cuticular plates of Srf cKO hair cells (HCs) at P10. (B) Quantification of phalloidin reactivity in the cuticular plates of HCs in control and Srf cKO mice at P10. The relative intensity changes are the ratio of phalloidin intensity of mutant and control cuticular plates. Analyzed numbers (cells, animals): inner hair cells (IHCs), control (68, 6), Srf cKO (67, 6). Outer hair cells (OHCs), control (240, 6), Srf cKO (269, 6). (C) LMO7 immunostaining in HCs of control and Srf cKO at P10. (D) TRIOBP immunostaining in IHCs of control and Srf cKO at P10. Side views of TRIOBP labeling in IHCs are on the right. (E) Quantification of rootlet length of the longest row of IHC stereocilia (as shown by arrows in D) in control and Srf cKO at P10. Analyzed numbers (stereocilia, cells, animals): control (50, 14, 4), Srf cKO (41, 12, 4). (F) Imaris 3D reconstruction of phalloidin-labeled cuticular plates in control and Srf cKO mice at P10. The contour of the cuticular plate outlined by a yellow line in Srf cKO represents the area used to calculate the volume of the cuticular plate. (G) Quantification of cuticular plate volume of control and Srf cKO IHCs. Analyzed numbers (cells, animals): control (20, 5), Srf cKO (22, 5). (H, I) Transmission electron microscopy (TEM) analysis of cuticular plates of IHCs and OHCs in control and Srf cKO at P10. In D, scale bar for the side-view represents 1 μm. In H and I, the scale bars represent 1 μm. Scale bars in other panels represent 5 μm. Error bars indicate standard deviation (SD), p values were derived from two-tailed unpaired Student’s t-test, ****p-value <0.0001, **p-value <0.01.
Figure 1—figure supplement 1

Conditional knockout of Srf in mice caused growth defects.
(A) Representative examples of P10 control and Srf cKO pups. (B) Body mass measurements of control and Srf cKO mice at P10. Analyzed numbers (animals): control (7), Srf cKO (8). Error bars indicate SD, p values were derived from two-tailed unpaired Student’s t-test, ***p value<0.001. (C) No significant size differences were found between control and Srf cKO inner ear at P10. (D) SRF immunoreactivity was obviously reduced in Srf cKO hair cells but not supporting cells. (E) Quantitative reverse transcription polymerase chain reaction (RT-qPCR) showed that compared to control, the expression level of Srf in Srf cKO hair cells reduced, normalized to GAPDH. In A, scale bar represents 1 cm. In C, scale bar presents 1 mm. In D, scale bars represent 5 μm. Error bars indicate standard error of the mean (SEM), p values were derived from one-way analysis of variance (ANOVA) followed by Bonferroni post-test, **p value<0.01.
Figure 2 with 1 supplement

The defects of stereocilia dimensions in Srf cKO mice.
(A) Phalloidin-stained inner hair cell (IHC) bundles of control and Srf cKO at different ages. En face views (scale bar, 5 μm) are on the left, and side views (scale bar, 1 μm) are on the right. (B) Fluorescence-based quantification of the length of row 1 IHC stereocilia at different cochlear positions, at P5 and P10. Analyzed numbers (stereocilia, cells, animals): middle IHCs, P5 control (60, 30, 5), P5 Srf cKO (62, 30, 5), P10 control (61, 25, 6), P10 Srf cKO (62, 26, 6). Basal IHCs, P5 control (41, 21, 5), P5 Srf cKO (53, 24, 5), P10 control (74, 28, 6), P10 Srf cKO (153, 53, 6). (C, D) Scanning electron microscopy (SEM) of outer hair cells (OHCs) and IHCs in control and Srf cKO mice at P10. (E) SEM-based quantification of row 1 stereocilia length and width in basal HCs at P10. Analyzed numbers: lengths: IHCs, control (42, 20, 5), Srf cKO (52, 18, 5). OHCs, control (149, 43, 5), Srf cKO (165, 42, 5). Widths: IHCs, control (88, 22, 5), Srf cKO (81, 20, 5). OHCs, control (164, 45, 5), Srf cKO (147, 42, 5). (F, G) SEM of OHCs and IHCs in control and Srf cKO mice at P15. (H) SEM-based quantification of rows 1 and 2 stereocilia width in basal IHCs at P15. Analyzed numbers: row 1, control (76, 11, 3), Srf cKO (150, 15, 3). Row 2, control (85, 11, 3), Srf cKO (134, 14, 3). Scale bars in C, D, F and G represent 5 μm. Error bars indicate standard deviation (SD), p values were derived from two-tailed unpaired Student’s t-test, ****p value<0.0001.
Figure 2—figure supplement 1

Srf cKO mice have defects in hair bundles.
(A) Phalloidin staining of control and Srf cKO outer hair cells (OHCs) hair bundles at various ages. (B) Phalloidin staining of control and Srf cKO hair bundles in P15 utricle. Upper, bundles of striolar HCs. Bottom, bundles of extrastriolar HCs. Higher magnification of hair bundles were shown on the right side of the panel. (C) Acetylated-tubulin immunostaining at P10 showed delayed kinocilia degeneration in Srf cKO inner hair cells (IHCs) compared to control. (D) Quantification of kinocilium-bearing control and Srf cKO IHCs at P10. Analyzed numbers (cells, animals): Apex, control (300, 3), Srf cKO (300, 3). Middle, control (300, 3), Srf cKO (307, 3). Base, control (390, 3), Srf cKO (400, 3). At least 100 cells were counted in each cochlear position for each mouse. Scale bars in all panels represent 5 μm. Error bars indicate standard deviation (SD), p values were derived from two-tailed unpaired Student’s t-test, **p value<0.01.
Figure 3
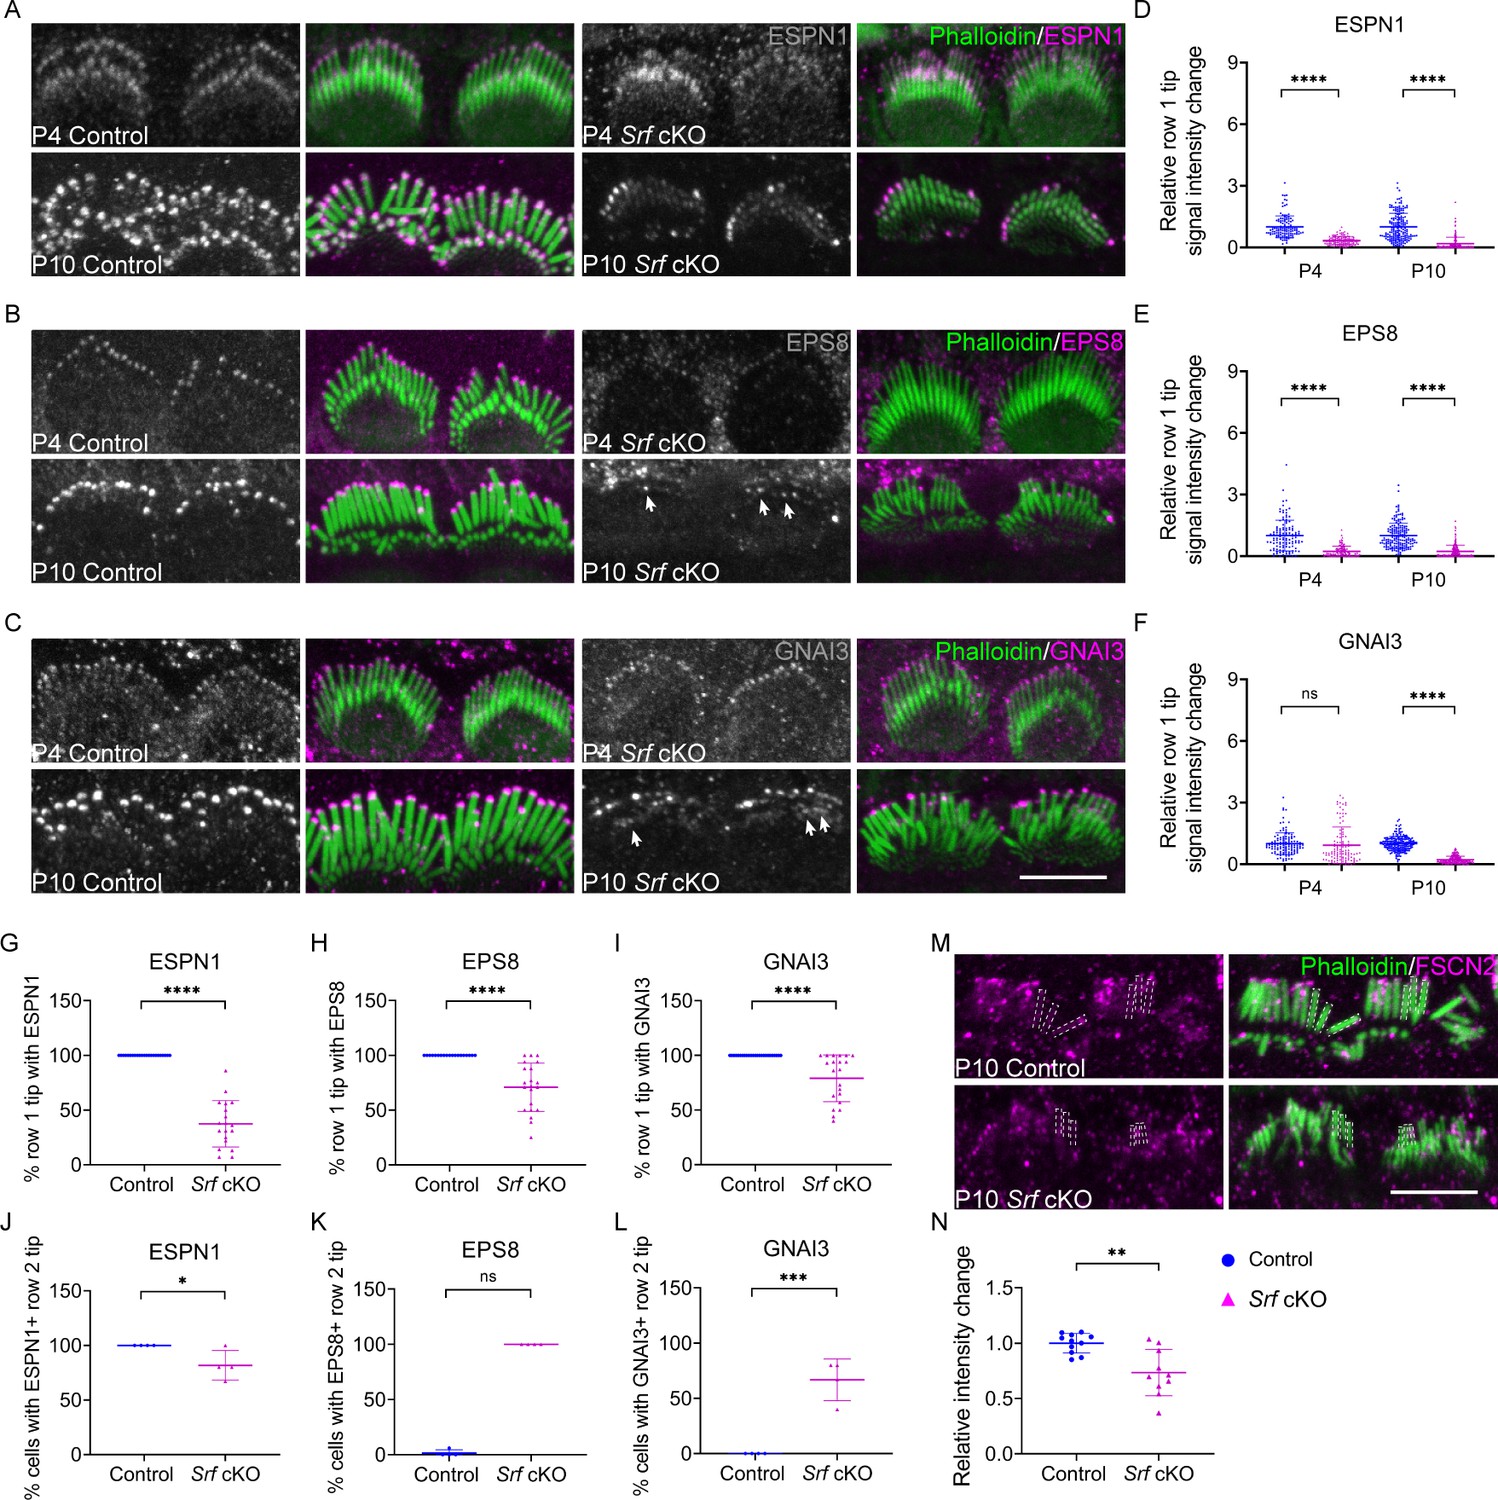
Altered distribution of tip proteins and actin crosslinker in Srf cKO mice.
(A–C) Immunofluorescence localization of ESPN1, EPS8, and GNAI3 in inner hair cells (IHCs) of control and Srf cKO at P4 and P10. Arrows indicate proteins staining on row 2 tips. Left panels are proteins staining separately from the phalloidin (in grayscale). (D–F) Quantitation of immunoreactivity of ESPN1, EPS8, and GNAI3 on IHCs stereocilia tips of control and Srf cKO, at P4 and P10. Analyzed numbers (stereocilia, cells, animals): ESPN1, P4 control (120, 12, 4), P4 Srf cKO (120, 12, 4), P10 control (180, 18, 5), P10 Srf cKO (170, 17, 5). EPS8, P4 control (120, 12, 5), P4 Srf cKO (110, 11, 5), P10 control (170, 17, 5), P10 Srf cKO (200, 20, 5). GNAI3, P4 control (120, 12, 4), P4 Srf cKO (110, 12, 4), P10 control (190, 19, 5), P10 Srf cKO (180, 18, 5). (G–I) Percentage of row 1 tip with ESPN1, EPS8, or GNAI3 staining to all row 1 stereocilia in IHCs of control and Srf cKO at P10. (J–L) Percentage of IHCs with ESPN1, EPS8, or GNAI3 staining on row 2 tips of control and Srf cKO at P10. Analyzed numbers in G–L (cells, animals): ESPN1, control (23, 5), Srf cKO (19, 5). EPS8, control (19, 5), Srf cKO (21, 5). GNAI3, control (25, 5), Srf cKO (21, 5). (M) FSCN2 immunostaining in control and Srf cKO IHCs. (N) Quantification of FSCN2 reactivity in IHC stereocilium shafts at P10. Analyzed numbers: control (110, 11, 5), Srf cKO (100, 10, 5). Scale bars, 5 μm. Error bars indicate standard deviation (SD), p values were derived from two-tailed unpaired Student’s t-test, ****p-value <0.0001, ***p-value <0.001, **p-value <0.01, and *p-value <0.05.
Figure 4 with 2 supplements
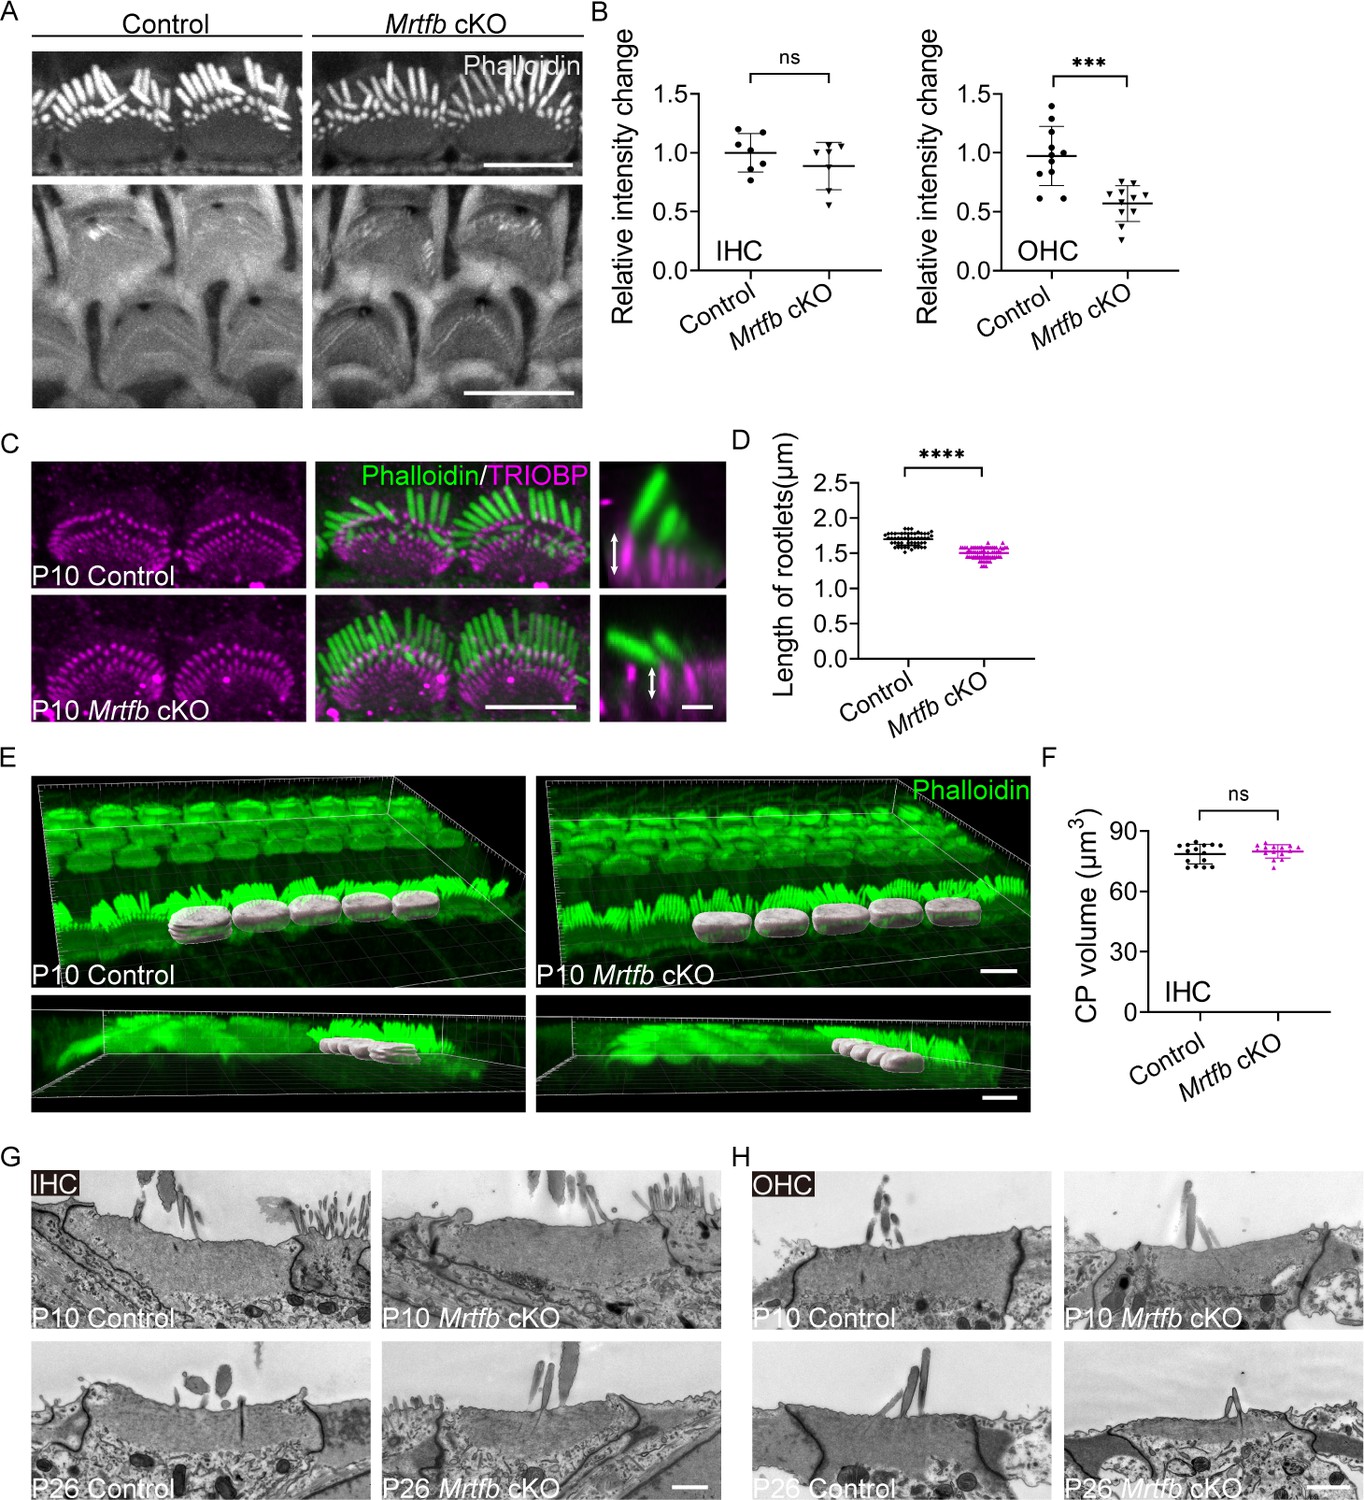
Mrtfb cKO mice have defects in the cuticular plates.
(A) Reduced phalloidin staining in the cuticular plates of Mrtfb cKO HCs at P10. (B) Quantification of phalloidin reactivity in the cuticular plates of inner hair cells (IHCs) and outer hair cells (OHCs) at P10. Analyzed numbers (cells, animals): IHCs, control (60, 6), Mrtfb cKO (63, 6). OHCs, control (261, 6), Mrtfb cKO (265, 6). (C) TRIOBP immunostaining of IHCs at P10. Side views of TRIOBP labeling in IHCs are on the right. (D) Quantification of length of row 1 IHC stereocilia rootlets (as shown by arrows in C). Analyzed numbers (stereocilia, cells, animals): control (52, 16, 4), Mrtfb cKO (63, 23, 4). (E) Imaris 3D reconstruction of phalloidin-labeled cuticular plates in control and Mrtfb cKO mice at P10. (F) Quantification of cuticular plate volume of control and Mrtfb cKO IHCs. Analyzed numbers (cells, animals): control (15, 4), Mrtfb cKO (15, 4). (G, H) Transmission electron microscopy (TEM) analysis of cuticular plates of IHCs and OHCs in control and Mrtfb cKO at P10 and P26. In C, scale bar for the side-view represents 1 μm. In G and H, the scale bars represent 1 μm. Scale bars in other panels represent 5 μm. Error bars indicate standard deviation (SD), p values were derived from two-tailed unpaired Student’s t-test, ****p value<0.0001, and ***p value<0.001.
Figure 4—figure supplement 1
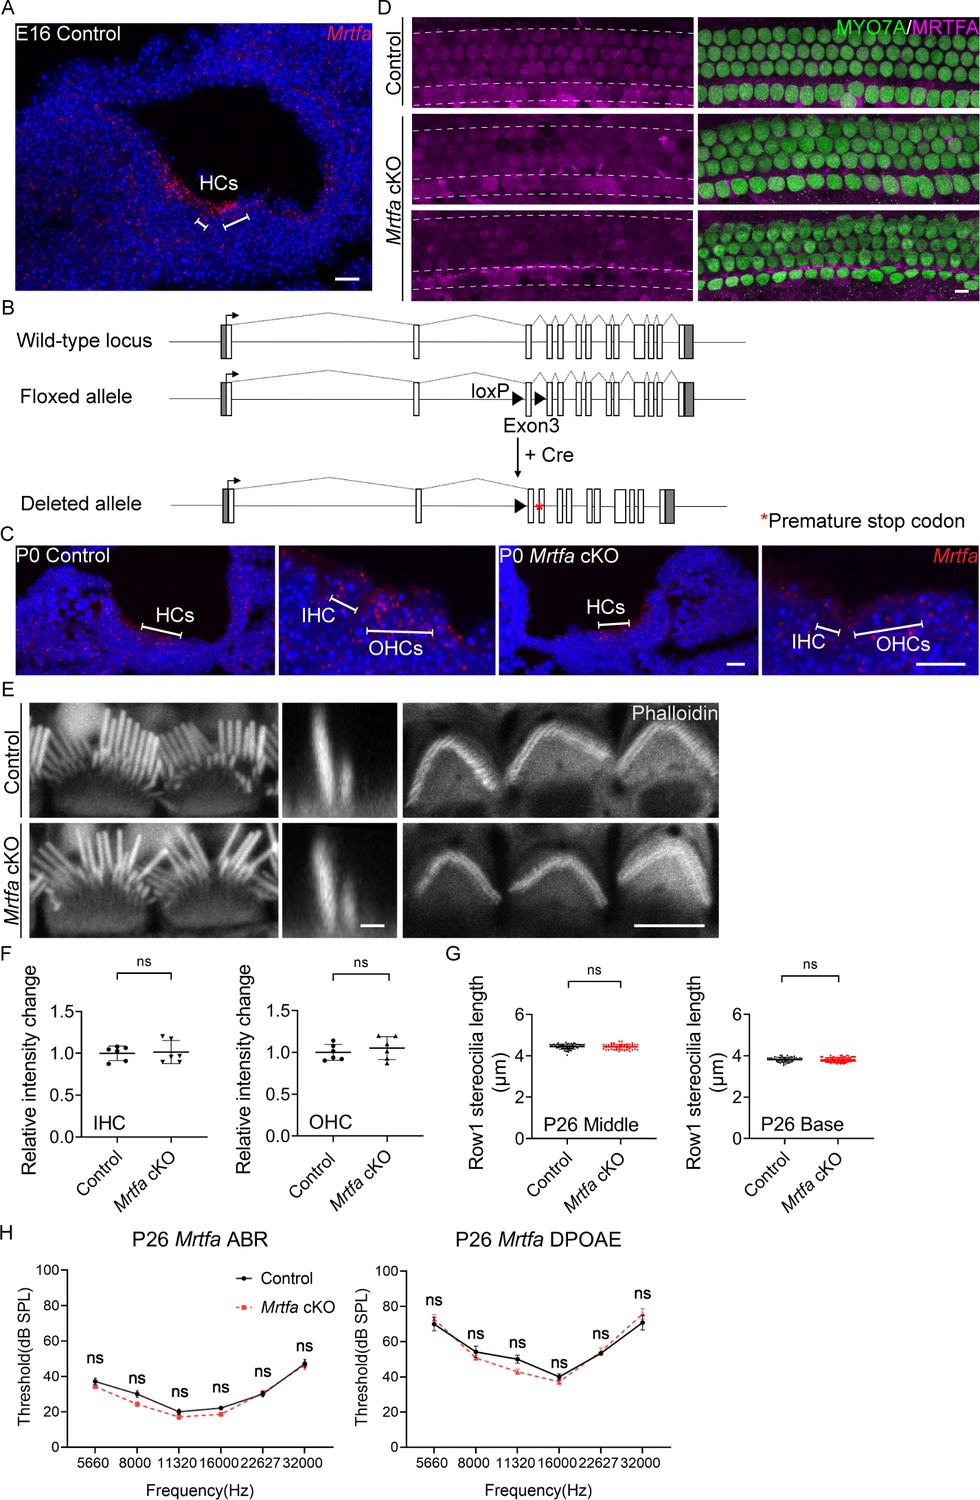
No obvious defects in HCs and hearing function of Mrtfa cKO mice.
(A) RNAscope in situ hybridization of Mrtfa in E16 control cochleae. (B) Genomic structures of mouse Mrtfa gene, CRISPR-mediated targeting allele, and mutated allele after Cre-mediated recombination. Exons are indicated by open boxes; untranslated regions are indicated by gray boxes. The loxP sites and premature stop codon are shown with black triangles and red asterisk. (C) RNAscope in situ hybridization of Mrtfa in P0 cochleae of control and Mrtfa cKO mice. (D) MRTFA immunostaining in P0 control and Mrtfa cKO cochlea. MRTFA immunoreactivity was significantly reduced in mutants. (E) Phalloidin staining of hair bundles in control and Mrtfa cKO at P26. Left and right panels are en face views of inner hair cell (IHC) and outer hair cell (OHC) bundles, middle panels are side views of IHC bundles. (F) Quantification of phalloidin reactivity in the cuticular plates of control and Mrtfa cKO HCs at P26. Analyzed numbers (cells, animals): IHCs, control (48, 4), Mrtfa cKO (48, 4). OHCs, control (144, 4), Mrtfa cKO (134, 4). (G) Quantification of row 1 stereocilia length in P26 control and Mrtfa cKO IHCs at different cochlear positions. Analyzed numbers (stereocilia, cells, animals): middle IHCs, control (62, 30, 4), Mrtfa cKO (47, 25, 4). Basal IHCs, control (55, 27, 4), Mrtfa cKO (71, 32, 4). (H) No significant difference was observed in auditory brainstem response (ABR) and distortion product otoacoustic emission (DPOAE) analysis between control and Mrtfa cKO mice at P26. Analyzed numbers (animals): control (7), Mrtfa cKO (7). In A and C, scale bars present 20 μm. In E, scale bar for the side-view represents 1 μm. Scale bars in other panels represent 5 μm. Error bars of F and G indicate standard deviation (SD), p values were derived from two-tailed unpaired Student’s t-test. Error bars of H indicate standard error of the mean (SEM), p values were derived from two-way analysis of variance (ANOVA) followed by Bonferroni post-test.
Figure 4—figure supplement 2
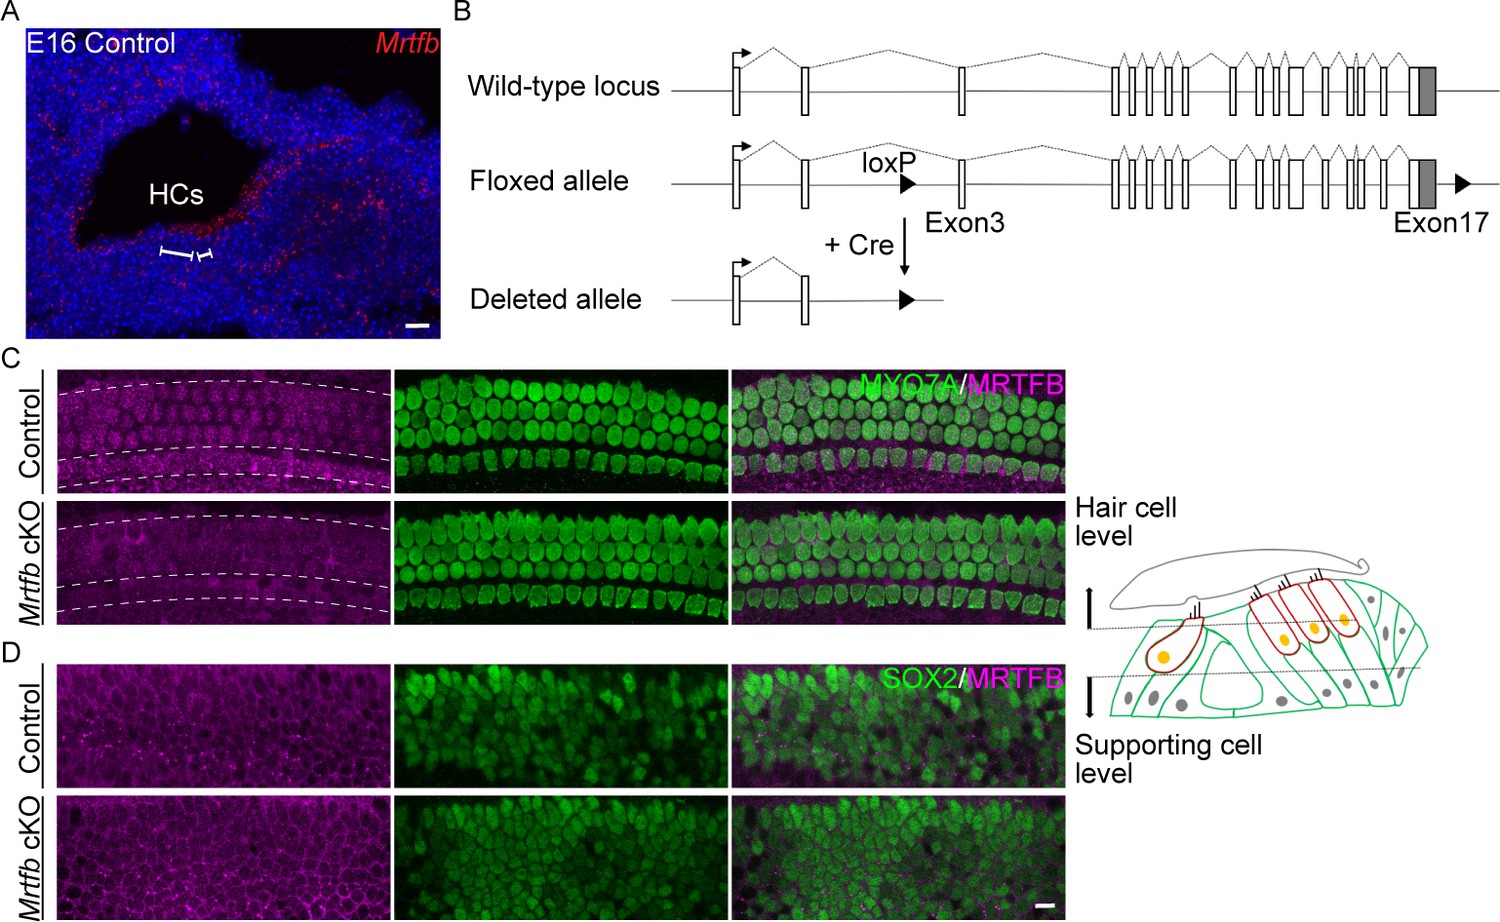
Conditional knockout of Mrtfb in mice.
(A) RNAscope in situ hybridization of Mrtfb in E16 control cochleae. (B) Genomic structures of mouse Mrtfb gene, CRISPR-mediated targeting allele, and mutated allele after Cre-mediated recombination. Exons are indicated by open boxes; untranslated regions are indicated by gray boxes. The loxP sites are shown with black triangles. (C, D) MRTFB immunoreactivity was reduced in P1 Mrtfb cKO cochlear hair cells, but not supporting cells. In A, scale bar represents 20 μm. In D, scale bar represents 5 μm.
Figure 5 with 1 supplement

The defects of stereocilia dimensions in Mrtfb cKO mice.
(A) Phalloidin staining of inner hair cell (IHC) bundles at different ages. En face views (scale bar, 5 μm) are on the left, and side views (scale bar, 1 μm) are on the right. (B) Fluorescence-based quantification of row 1 IHC stereocilia length at different cochlear positions and ages. Analyzed numbers: middle IHCs, P5 control (41, 20, 6), P5 Mrtfb cKO (53, 23, 6), P10 control (80, 35, 6), P10 Mrtfb cKO (36, 18, 6), P26 control (73, 23, 5), P26 Mrtfb cKO (71, 24, 5). Basal IHCs, P5 control (65, 28, 6), P5 Mrtfb cKO (60, 25, 6), P10 control (83, 39, 6), P10 Mrtfb cKO (48, 22, 6), P26 control (74, 25, 5), P26 Mrtfb cKO (73, 24, 5). (C, D) Scanning electron microscopy (SEM) of outer hair cells (OHCs) and IHCs at P10. (E) SEM-based quantification of row 1 stereocilia length and width in basal HCs of control and Mrtfb cKO at P10. Analyzed numbers: lengths: IHCs, control (50, 20, 6), Mrtfb cKO (59, 20, 6). OHCs, control (127, 33, 6), Mrtfb cKO (132, 39, 6). Widths: IHCs, control (65, 22, 5), Mrtfb cKO (58, 22, 5). OHCs, control (135, 35, 5), Mrtfb cKO (118, 39, 5). (F, G) SEM of OHCs and IHCs at P42. (H) SEM-based quantification of row 1 stereocilia length and width in basal IHCs of control and Mrtfb cKO at P42. Analyzed numbers: lengths, control (42, 22, 6), Mrtfb cKO (63, 24, 6). Widths, control (86, 22, 6), Mrtfb cKO (92, 24, 6). Scale bars in C, D, F and G represent 5 μm. Error bars indicate standard deviation (SD), p values were derived from two-tailed unpaired Student’s t-test, ****p value<0.0001, and *p value<0.05.
Figure 5—figure supplement 1

Mrtfb cKO mice have stereocilia impairments.
(A) Phalloidin staining of outer hair cell (OHC) bundles in control and Mrtfb cKO at different ages. (B) Phalloidin staining of hair bundles in P60 control and Mrtfb cKO utricle. Upper, bundles of striolar HCs. Bottom, bundles of extrastriolar HCs. Higher magnification of hair bundles were shown on the right side of the panel. Scale bars in all panels represent 5 μm.
Figure 6

Altered distribution of tip proteins and actin crosslinker in Mrtfb cKO mice.
(A–C) Immunofluorescence localization of ESPN1, EPS8, and GNAI3 in inner hair cells (IHCs) of control and Mrtfb cKO mice at different ages. Left panels are proteins staining separately from the phalloidin (in grayscale). (D–F) Quantitation of immunoreactivity of ESPN1, EPS8, and GNAI3 in IHCs of control and Mrtfb cKO at different ages. Analyzed numbers (stereocilia, cells, animals): ESPN1, P4 control (110, 11, 4), P4 Mrtfb cKO (110, 11, 4), P10 control (130, 13, 5), P10 Mrtfb cKO (140, 14, 5), P15 control (110, 11, 4), P15 Mrtfb cKO (120, 12, 4). EPS8, P4 control (120, 12, 5), P4 Mrtfb cKO (100, 10, 5), P10 control (190, 19, 5), P10 Mrtfb cKO (200, 20, 5), P15 control (110, 11, 5), P15 Mrtfb cKO (110, 11, 5). GNAI3, P4 control (120, 12, 5), P4 Mrtfb cKO (110, 11, 5) P10 control (100, 10, 4), P10 Mrtfb cKO (100, 10, 4), P15 control (100, 11, 4), P15 Mrtfb cKO (120, 11, 4). (G–I) Percentage of row 1 tip with ESPN1, EPS8, or GNAI3 staining to all row 1 stereocilia in IHCs of control and Mrtfb cKO at P10. (J–L) Percentage of IHCs with ESPN1, EPS8, or GNAI3 staining on the row 2 tips of control and Mrtfb cKO at P10. Analyzed numbers in G–L (cells, animals): ESPN1, control (24, 5), Mrtfb cKO (20, 5). EPS8, control (24, 5), Mrtfb cKO (24, 5). GNAI3, control (24, 4), Mrtfb cKO (21, 4). (M) FSCN2 immunostaining in control and Mrtfb cKO IHCs. (N) Quantification of FSCN2 reactivity in IHC stereocilium shafts at P10. Analyzed numbers (stereocilia, cells, animals): control (130, 13, 6), Mrtfb cKO (120, 12, 6). Scale bars, 5 μm. Error bars indicate standard deviation (SD), p values were derived from two-tailed unpaired Student’s t-test, ****p value<0.0001, ***p value<0.001, and **p value<0.01.
Figure 7 with 1 supplement
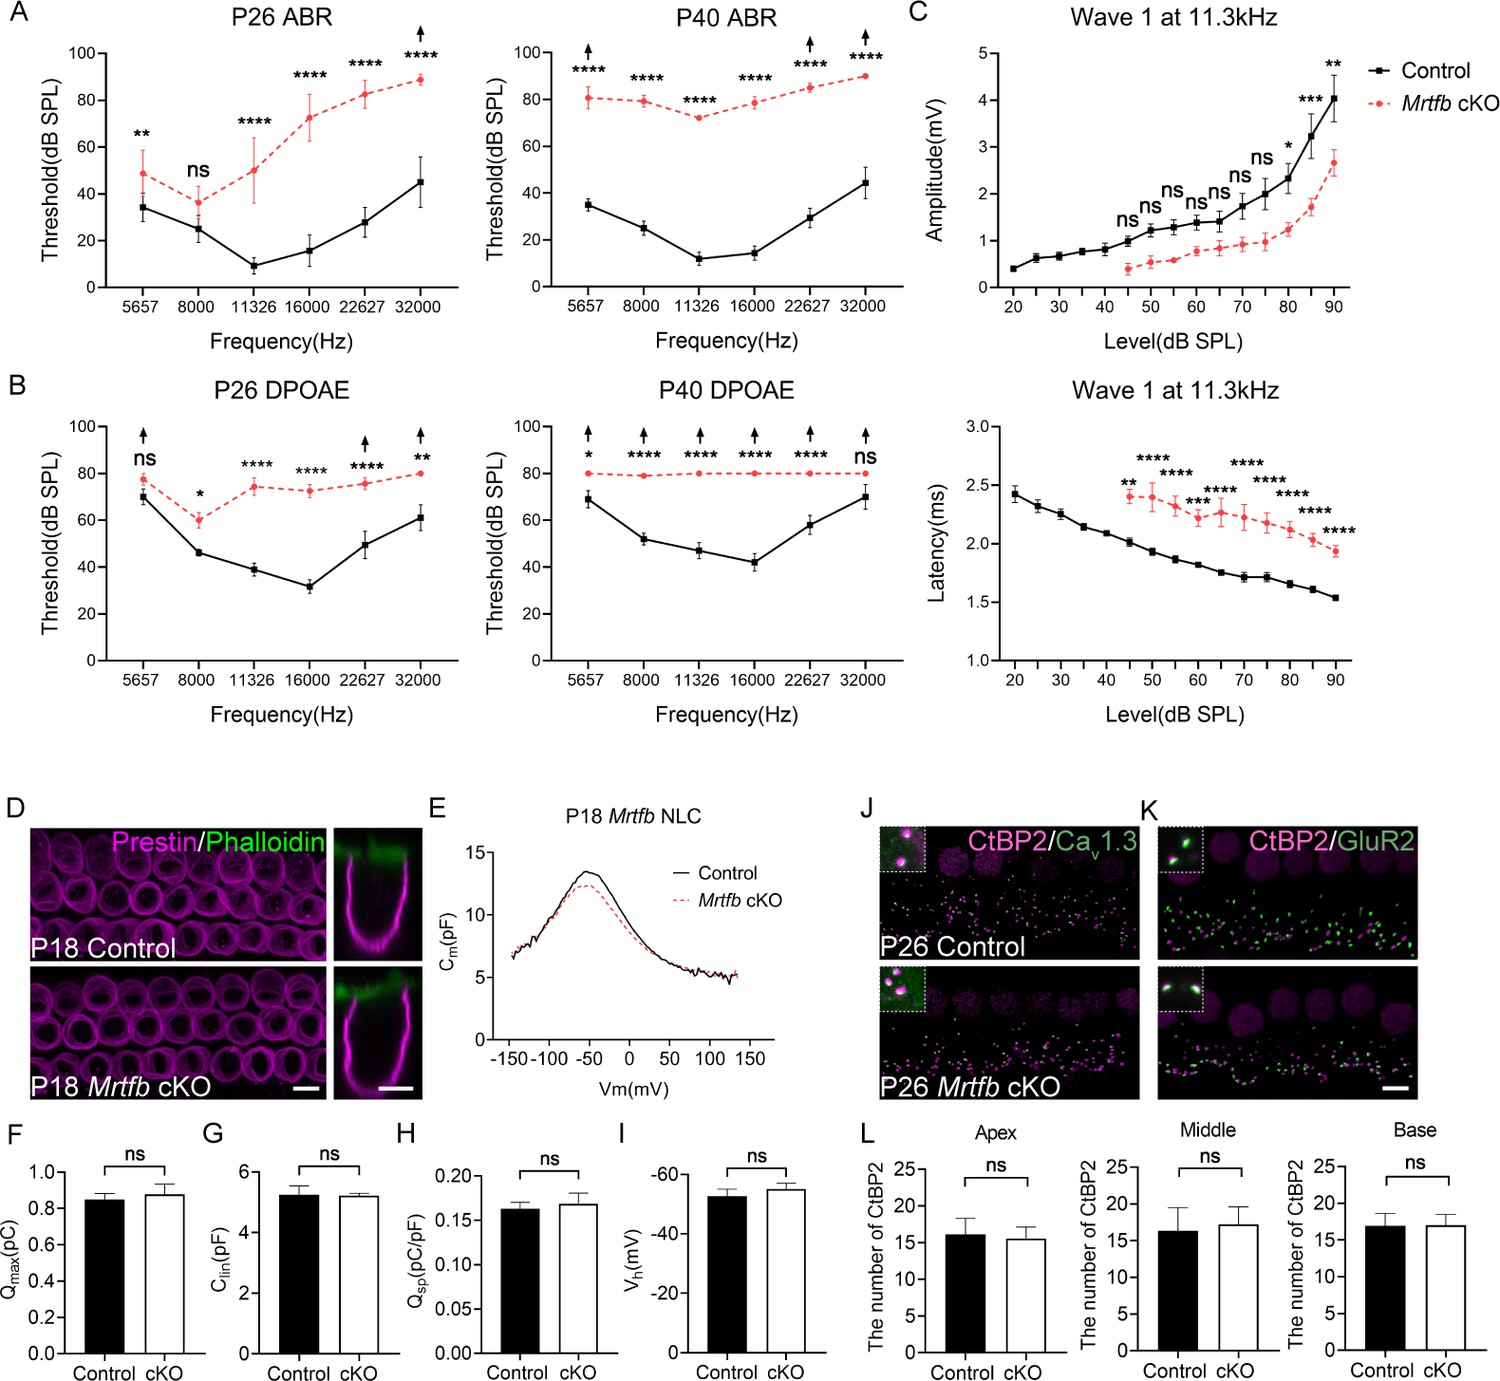
Early-onset and progressive hearing loss in Mrtfb cKO mice.
(A) Auditory brainstem response (ABR) analysis demonstrates Mrtfb cKO mice exhibited early-onset and progressive hearing loss. (B) Distortion product otoacoustic emission (DPOAE) thresholds in Mrtfb cKO mice were significantly elevated at P26 and at P42 compared to control. (C) ABR wave1 amplitude (upper panel) and latency (lower panel) at 11.3 kHz in control and Mrtfb cKO mice at P26. Analyzed numbers (animals): P26, control (7), Mrtfb cKO (8). P42, control (8), Mrtfb cKO (7). Arrows indicate that at fixed frequency, no response was identified at the maximum output. Error bars indicate standard error of the mean (SEM), p values were derived from two-way analysis of variance (ANOVA) followed by Bonferroni post-test. (D) Prestin immunostaining in outer hair cells (OHCs) at P18, side views of OHCs are on the right. (E) Nonlinear capacitance (NLC) recordings of OHCs in control and Mrtfb cKO mice at P18. (F–I) Quantitative analysis of Qmax, Clin, Qsp, and Vh showed no significant difference between control and Mrtfb cKO OHCs. Analyzed numbers (cells, animals): control (5, 4), Mrtfb cKO (5, 4). (J, K) CtBP2-Cav1.3 and CtBP2-GluR2 co-immunostaining in inner hair cells (IHCs). Higher magnification images are in the upper dotted box. (L) Comparison of IHC ribbon synapse numbers between control and Mrtfb cKO mice at different cochlear positions at P26. Analyzed numbers (cells, animals): apical turns, control (28, 5), Mrtfb cKO (28, 5). Middle turns, control (20, 6), Mrtfb cKO (26, 6). Basal turns, control (34, 6), Mrtfb cKO (32, 6). Scale bars in all panels represent 5 μm. Error bars indicate standard deviation (SD), p values were derived from two-tailed unpaired Student’s t-test. ****p-value <0.0001, ***p-value <0.001, **p-value <0.01, and *p-value <0.05.
Figure 7—figure supplement 1

Hair cell numbers were not affected in Mrtfb cKO mice.
(A, B) The hair cell numbers were not affected in Mrtfb cKO mice at P26. Analyzed numbers (animals): P26, control (4), Mrtfb cKO (4). P42, control (3), Mrtfb cKO (3). Scale bar, 5 μm. Error bars indicate standard deviation (SD), p values were derived from two-tailed unpaired Student’s t-test, ***p value<0.001.
Figure 8 with 1 supplement
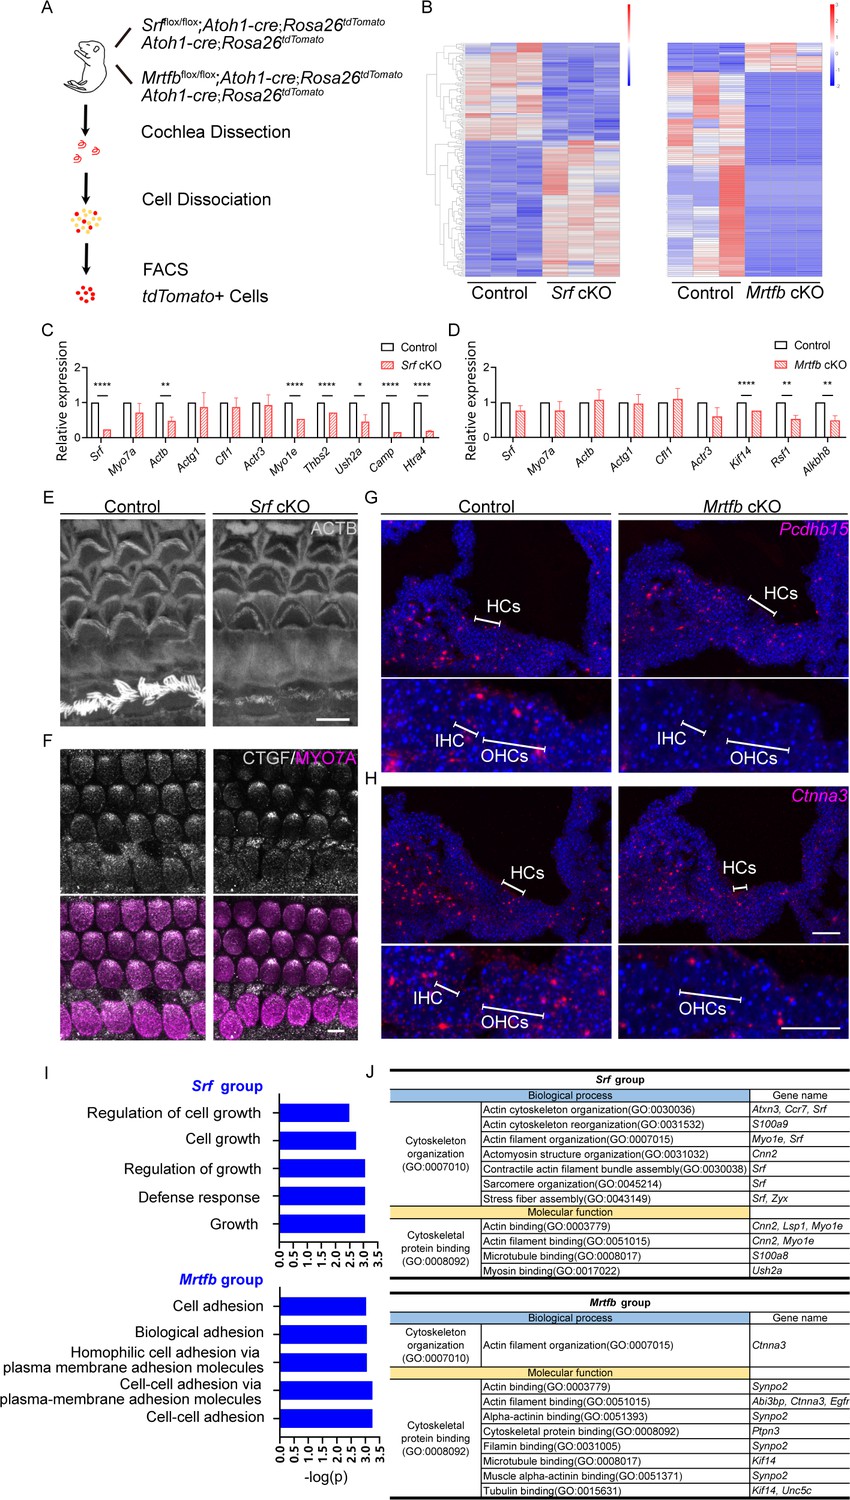
Srf cKO and Mrtfb cKO hair cell transcriptome analysis.
(A) Diagram of fluorescence-activated cell sorting (FACS) purification strategy to isolate hair cells. The genotypes of mice used for cell sorting are on the right of the mouse cartoon. (B) The heatmaps of all the differentially expressed genes (DEGs) in Srf cKO and Mrtfb cKO (padj < 0.05 and |log2(fold change)| > 1). Color-coded key bar indicates normalized expression values, relatively high expression levels are indicated by red colors, whereas blue colors represent lower expression levels. (C, D) RT-qPCR validation of the expression levels of genes identified in control, Srf cKO and Mrtfb cKO RNA-Seq, normalized to GAPDH. Error bars indicate standard error of the mean (SEM), p values were derived from one-way analysis of variance (ANOVA) followed by Bonferroni post-test, ****p value<0.0001, **p value<0.01, and *p value<0.05. (E, F) Reduced ACTB and CTGF immunostaining in Srf cKO HCs. Scale bars, 5 μm. (G, H) RNAscope in situ hybridizations analysis of Pcdhb15 and Ctnna3 expression in P2 frozen sections of cochleae from control and Mrtfb mutants. Nuclei were labeled with 4'-6-diamidino-2-phenylindole (DAPI). Scale bar, 20 μm. (I) Gene Ontology (GO) enrichment analysis (Biological Process) of down-regulated DEGs in Srf cKO and Mrtfb cKO. (J) Summary of functional clustering of down-regulated DEGs by Srf or Mrtfb deficiency, according to gene’s GO annotations in Gene Ontology Resource.
Figure 8—figure supplement 1
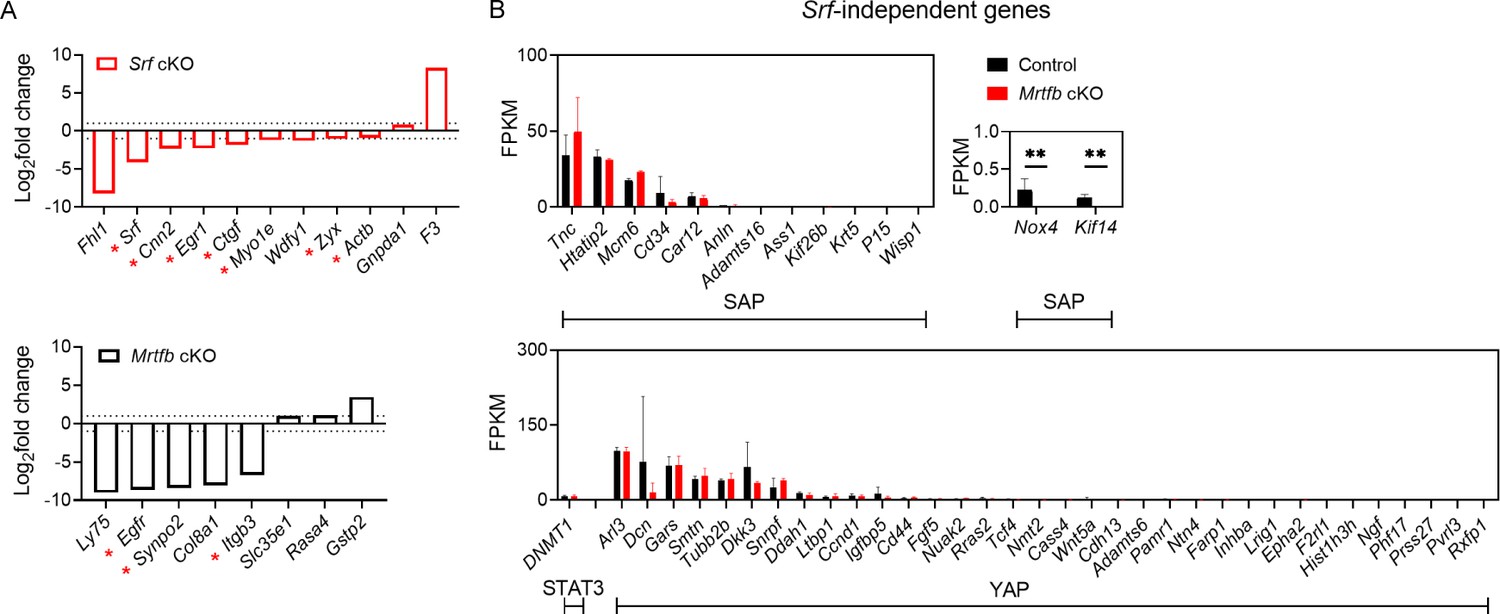
Validation of RNA-sequencing results.
(A) Comparison of Srf cKO or Mrtfb cKO’s regulated genes which are known downstream of MRTF–SRF pathway. Dotted lines on the plot represent the cutoff to annotate the differentially expressed genes (DEGs). Asterisks indicate the genes involved in the regulation of cytoskeleton. (B) The expression level of the reported Srf-independent genes sets in control and Mrtfb cKO, indicated by FPKM. Error bars indicate standard deviation (SD), **p-value <0.01.
Figure 9 with 1 supplement

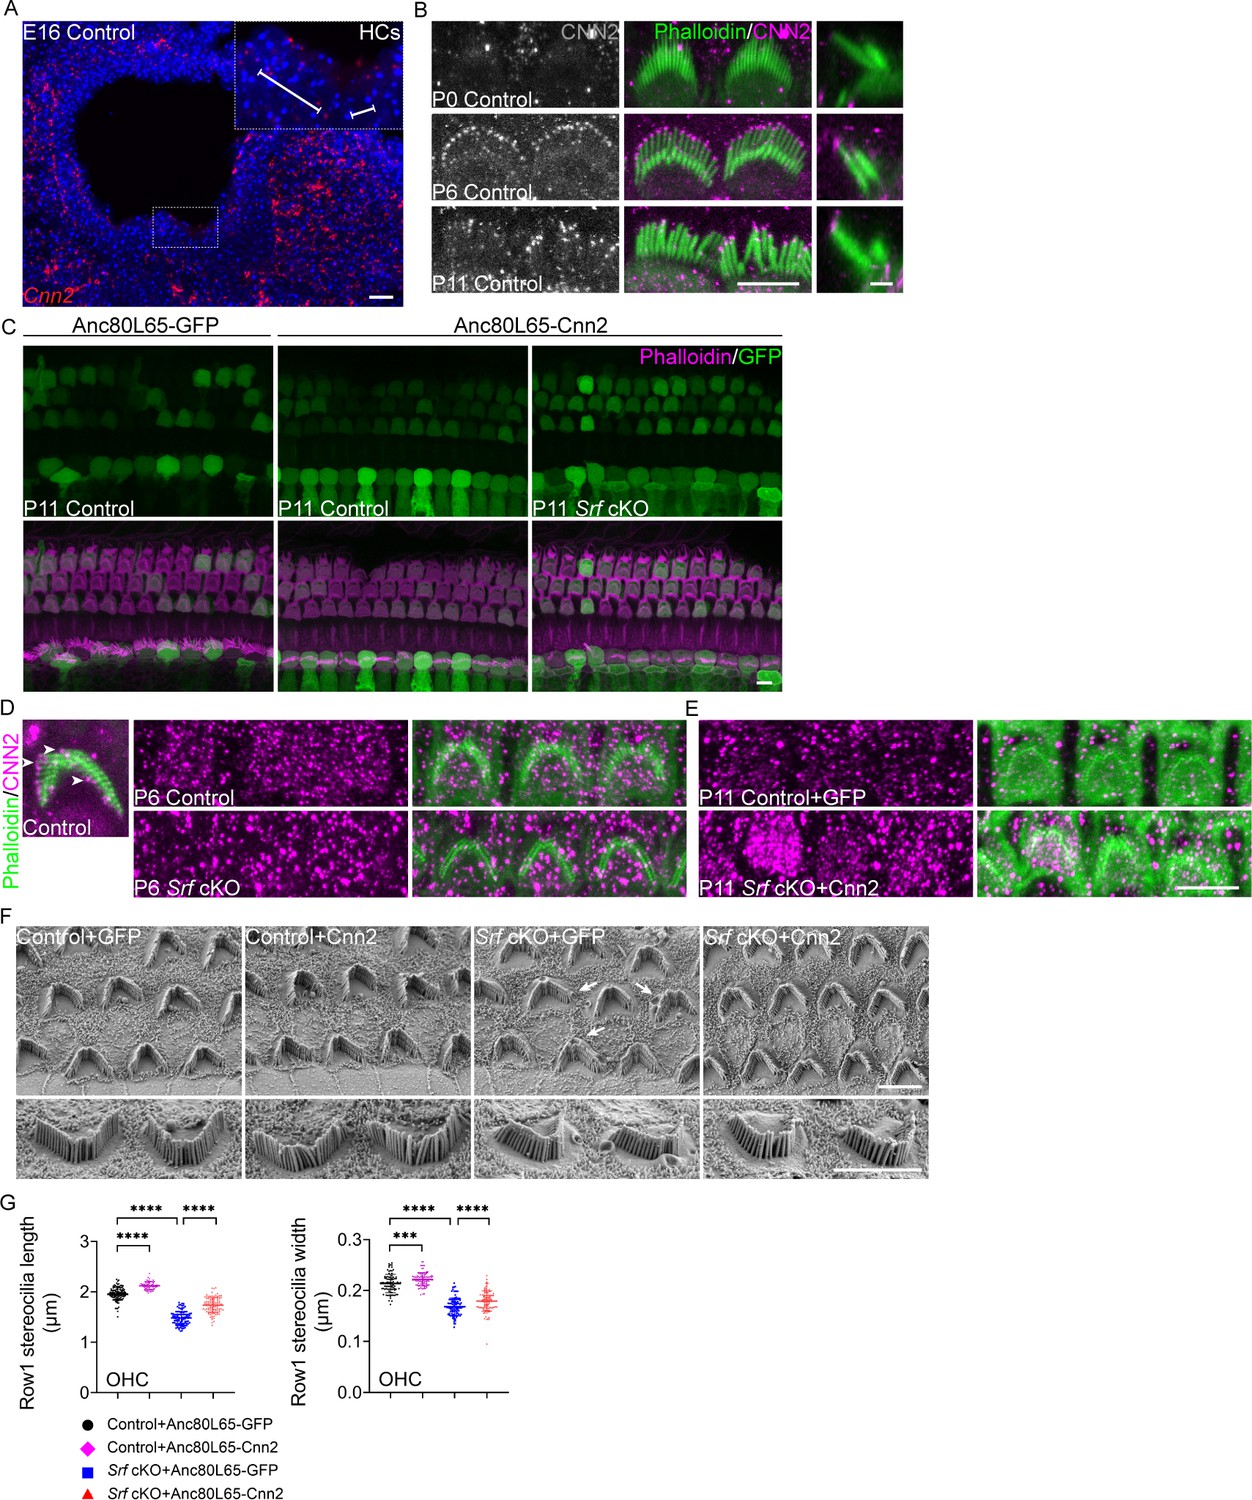
The injection of Anc80L65-Cnn2 partially restores the cuticular plate integrity and stereocilia morphology in Srf cKO mice.
(A, B) CNN2 immunostaining in the stereocilia and cuticular plates of P6 inner hair cells (IHCs). (C) Quantitation of CNN2 reactivity in row 1 IHC stereocilia. Analyzed numbers (stereocilia, cells, animals): control (100, 10, 4), Srf cKO (110, 11, 4). (D) Depiction of the experimental paradigm for in vivo virus injection. (E, F) CNN2 immunostainings in the stereocilia and cuticular plates of P11 control mice injected with Anc80L65-GFP or Anc80L65-Cnn2, and Srf cKO injected with Anc80L65-Cnn2.The bottom panels in E and all panels in F were taken at the level of the cuticular plate. The GFP expression in IHCs of Srf cKO injected with Anc80L65-Cnn2 indicate the efficiency of Cnn2 delivery. Arrowheads indicate CNN2 at row 2 stereocilia tips. (G) Phalloidin staining in the cuticular plates of Anc80L65-GFP-injected control, Anc80L65-Cnn2-injected control, Anc80L65-GFP-injected Srf cKO, and Anc80L65-Cnn2-injected Srf cKO hair cells at P11. (H) Quantification of phalloidin reactivity in the cuticular plates of P12 IHCs and outer hair cells (OHCs) from Anc80L65-GFP-injected control, Anc80L65-Cnn2-injected control, Anc80L65-GFP-injected Srf cKO, and Anc80L65-Cnn2-injected Srf cKO mice. Analyzed numbers (cells, animals): IHCs, Anc80L65-GFP-injected control (52, 5), Anc80L65-Cnn2-injected control (47, 5), Anc80L65-GFP-injected Srf cKO (49, 5), Anc80L65-Cnn2-injected Srf cKO (61, 6). OHCs, Anc80L65-GFP-injected control (194, 5), Anc80L65-Cnn2-injected control (147, 5), Anc80L65-GFP-injected Srf cKO (150, 5), Anc80L65-Cnn2-injected Srf cKO (204, 6). (I) Representative scanning electron microscopy (SEM) images of P11 apical IHCs of Anc80L65-GFP-injected control, Anc80L65-Cnn2-injected control, Anc80L65-GFP-injected Srf cKO, and Anc80L65-Cnn2-injected Srf cKO. Arrowheads indicate abnormal thin stereocilia tips. (J) SEM-based quantification of row 1 stereocilia length and width of P11 apical IHCs. Analyzed numbers (stereocilia, cells, animals): lengths, Anc80L65-GFP-injected control (52, 16, 4), Anc80L65-Cnn2-injected control (44, 13, 5), Anc80L65-GFP-injected Srf cKO (70, 20, 5), Anc80L65-Cnn2-injected Srf cKO (99, 30, 6). Widths, Anc80L65-GFP-injected control (107, 20, 4), Anc80L65-Cnn2-injected control (75, 20, 5), Anc80L65-GFP-injected Srf cKO (121, 25, 5), Anc80L65-Cnn2-injected Srf cKO (130, 30, 6). In E, the scale bar for side-view represents 1 μm and scale bars in other panels represent 5 μm. Error bars indicate standard deviation (SD), p values were derived from two-tailed unpaired Student’s t-test, ****p value<0.0001, ***p value<0.001, and **p value<0.01.
Figure 9—figure supplement 1
The injection of AAV-Anc80L65-Cnn2 partially restores outer hair cell (OHC) stereocilia morphology in Srf cKO mice.
(A) RNAscope in situ hybridization of Cnn2 in E16 control cochlea. Inset indicates hair cells. (B) Immunohistochemical analysis of CNN2 expression in control inner hair cells (IHCs) at different ages. Right panels are side views. (C) The infection patterns of Anc80L65-GFP and Anc80L65-Cnn2 in hair cells of control and Srf cKO. (D) CNN2 immunoreactivity in the stereocilia and cuticular plates of OHCs. Left: CNN2 staining in the stereocilia of control OHCs at P6. Arrowheads indicate CNN2 at row 1 stereocilia tips. Right: CNN2 staining in the cuticular plates of control and Srf cKO OHCs at P6. (E) CNN2 immunostainings in the cuticular plates of Anc80L65-GFP-injected control and Anc80L65-Cnn2-injected Srf cKO OHCs at P11. (F) Representative scanning electron microscopy (SEM) images of P11 apical OHCs of Anc80L65-GFP-injected control, Anc80L65-Cnn2-injected control, Anc80L65-GFP-injected Srf cKO, and Anc80L65-Cnn2-injected Srf cKO. Arrows indicate the raised apical plasma membrane of cuticular plate in Srf cKO hair cells. (G) SEM-based quantification of row 1 stereocilia length and width in P11 apical OHCs of Anc80L65-GFP-injected control, Anc80L65-GFP-injected Srf cKO, and Anc80L65-Cnn2-injected Srf cKO. Analyzed numbers (stereocilia, cells, animals): lengths: Anc80L65-GFP-injected control (117, 35, 4), Anc80L65-Cnn2-injected control (66, 25, 5), Anc80L65-GFP-injected Srf cKO (100, 32, 5), Anc80L65-Cnn2-injected Srf cKO (101, 30, 6). Widths: Anc80L65-GFP-injected control (90, 30, 4), Anc80L65-Cnn2-injected control (94, 30, 5), Anc80L65-GFP-injected Srf cKO (105, 35, 5), Anc80L65-Cnn2-injected Srf cKO (111, 32, 6). In A, scale bar represents 20 μm. In B, scale bar for the side-view represents 1 μm. Scale bars in others panels represent 5 μm. Error bars indicate standard deviation (SD), p values were derived from two-tailed unpaired Student’s t-test, ****p value<0.0001, and ***p value<0.001.
Figure 10

An illustration model of differential regulation of actin cytoskeleton mediated by SRF and MRTFB in hair cells.
Additional files
-
Supplementary file 1
Primer sequences used for PCR and RT-qPCR.
- https://cdn.elifesciences.org/articles/90155/elife-90155-supp1-v2.xlsx
-
MDAR checklist
- https://cdn.elifesciences.org/articles/90155/elife-90155-mdarchecklist1-v2.pdf
Download links
A two-part list of links to download the article, or parts of the article, in various formats.
Downloads (link to download the article as PDF)
Open citations (links to open the citations from this article in various online reference manager services)
Cite this article (links to download the citations from this article in formats compatible with various reference manager tools)
Differential regulation of hair cell actin cytoskeleton mediated by SRF and MRTFB
eLife 12:e90155.
https://doi.org/10.7554/eLife.90155


