Postsynaptic mitochondria are positioned to support functional diversity of dendritic spines
- Electron Microscopy Core Facility, Max Planck Florida Institute for Neuroscience, Max Planck Way, United States
- Department of Neuroscience, Perelman School of Medicine at the University of Pennsylvania, United States
Abstract
Postsynaptic mitochondria are critical for the development, plasticity, and maintenance of synaptic inputs. However, their relationship to synaptic structure and functional activity is unknown. We examined a correlative dataset from ferret visual cortex with in vivo two-photon calcium imaging of dendritic spines during visual stimulation and electron microscopy reconstructions of spine ultrastructure, investigating mitochondrial abundance near functionally and structurally characterized spines. Surprisingly, we found no correlation to structural measures of synaptic strength. Instead, we found that mitochondria are positioned near spines with orientation preferences that are dissimilar to the somatic preference. Additionally, we found that mitochondria are positioned near groups of spines with heterogeneous orientation preferences. For a subset of spines with a mitochondrion in the head or neck, synapses were larger and exhibited greater selectivity to visual stimuli than those without a mitochondrion. Our data suggest mitochondria are not necessarily positioned to support the energy needs of strong spines, but rather support the structurally and functionally diverse inputs innervating the basal dendrites of cortical neurons.
eLife assessment
This study reports valuable findings on the correlation between the positions of dendritic mitochondria and the orientation preference of calcium responses of individual spines. The conclusion about the biased localization of dendritic mitochondria near functional diverse spines is informative to understand the functions of dendritic mitochondria. The experimental evidence supporting the conclusion is compelling.
https://doi.org/10.7554/eLife.89682.3.sa0Introduction
By volume, mitochondria are the most prolific organelle in neuronal compartments. Mitochondria are observed within cell bodies, dendritic processes, axons, and occasionally dendritic protrusions (Cameron et al., 1991; Li et al., 2004; Kasthuri et al., 2015; Faitg et al., 2021; Pekkurnaz and Wang, 2022). Their abundance is thought to reflect a critical role: supporting the energy demands of neuronal communication through a supply of adenosine triphosphate (ATP) (Datta and Jaiswal, 2021). Neuronal communication occurs through synapses, and the process of transforming action potentials into graded postsynaptic depolarization is one of the most energy-expensive processes in the brain (Rossi and Pekkurnaz, 2019). ATP supplied by mitochondria is needed for postsynaptic glutamate receptor activation, presynaptic vesicle endo/exocytosis pathways, glutamate recycling, and Ca2+ channel activity (Attwell and Laughlin, 2001; Harris et al., 2012). Mitochondria are also involved in local protein synthesis, protein transport, and Ca2+ buffering critical for synapse maintenance and structural dynamics (Lipton and Whittingham, 1982; Li et al., 2004; Cheng et al., 2010; Harris et al., 2012; Rangaraju et al., 2014; Datta and Jaiswal, 2021). While there is growing evidence that mitochondria support synaptic activity, how this support is achieved is largely unknown. Some research suggests that ATP might diffuse from distant sources (Pathak et al., 2015), but the limited rate of diffusion of ATP in the cytosol implies the importance of spatial positioning close to synaptic compartments (Belles et al., 1987; Hubley et al., 1996; Devine and Kittler, 2018). Thus, it is unclear to what extent mitochondrial positioning is orchestrated within neuronal compartments to meet the demands of local synaptic inputs.
Adding further complexity, mitochondria are heterogeneous in morphology and density, in a manner dependent on subcellular compartment (e.g. presynapse vs. postsynapse). Presynaptic mitochondria are generally smaller, shorter, and less complex than those in dendrites of the same brain area (Delgado et al., 2019; Faitg et al., 2021; Turner et al., 2022). Ultrastructural correlations reveal a strong link between synaptic strength and mitochondrial abundance: larger boutons, which typically contain a greater number of presynaptic vesicles and are correlated with synapse strength and efficacy (Schikorski and Stevens, 1997), contain larger mitochondria and, occasionally, a greater number of mitochondria (Wilke et al., 2013; Cserép et al., 2018; Rodriguez-Moreno et al., 2018). Scaling to meet presynaptic energy demands has also been shown in the calyx of Held where synapse functional maturation correlates with a dramatic increase in mitochondrial volume and organization (Thomas et al., 2019). However, while evidence grows for the specific recruitment of mitochondria to the presynapse, the nature of postsynaptic mitochondria is largely unstudied (Faitg et al., 2021).
Postsynaptic mitochondria are primarily located within dendritic shafts, rarely found extending into dendritic spines or inside the spine head (Cameron et al., 1991; Li et al., 2004; Kasthuri et al., 2015). Dendritic mitochondria are largely thought to provide local energetic support, based on studies relating mitochondrial and synapse abundance. Mitochondrial density along the dendrite co-varies with synapse density in the neocortex (Turner et al., 2022). Additionally, dendritic mitochondria are found closer to excitatory synapses than expected by chance in retinal ganglion cells, and a similar relationship has been shown in cultured neurons (Li et al., 2004; Chang et al., 2006; Faits et al., 2016). In vivo measurements of mitochondria Ca2+ influx correlate with cytosolic calcium influx (Datta and Jaiswal, 2021), potentially supporting local synaptic activity via calcium buffering. However, a missing piece of this framework is whether dendritic mitochondria are organized to support the structure and function of individual dendritic spines and their synaptic activity.
A spatial relationship between mitochondria and dendritic spines may be critically important. Dendritic spines exhibit a wide diversity of morphologies and functional response properties compared to the somatic output (Scholl et al., 2021). Given the wide collection of synaptic inputs, conveying distinct information (Scholl and Fitzpatrick, 2020) at different input rates (Goris et al., 2015), it is reasonable to suggest that mitochondria are precisely positioned to support highly active synapses onto dendritic spines or those with greater influence on somatic action potentials. In addition, dendrites can exhibit homogeneous or heterogeneous clustering of synaptic activity (Wilson et al., 2016), and functional organization motifs may require distinct energetic support. However, it is an open question whether mitochondria are preferentially positioned to support certain populations of dendritic spines over others based on their structure or sensory-driven activity.
We address this question by combining in vivo two-photon Ca2+ imaging of dendritic spines driven by visual stimuli and serial block-face scanning electron microscopy (SBF-SEM) reconstructions of L2/3 pyramidal neurons of ferret visual cortex (Scholl et al., 2021). Using a deep learning method for unsupervised 3D identification of mitochondria in the EM volumes, we characterized the volume of dendritic mitochondria near individual dendritic spines and compared it to structural and functional measurements. While mitochondrial volume was unrelated to dendritic spine morphology, we discovered a surprising functional correlation: local mitochondria were positioned near spines differentially tuned to the somatic output and those in regions with functional heterogeneity. Additionally, spines that contain a mitochondrion in the head or neck were larger and more selective to visual stimuli. Our novel dataset and analysis suggest that dendritic mitochondria are precisely positioned to support functional synaptic diversity of cortical neurons.
Results
Characterizing postsynaptic mitochondria in 3D EM volumes from ferret visual cortex
To investigate the subcellular organization of dendritic mitochondria, we returned to our previously published CLEM dataset (Scholl et al., 2021). This dataset contains individual layer 2/3 neurons from the ferret visual cortex for which basal dendrites were examined in vivo with two-photon calcium imaging of GCaMP6s during visual stimulation, and then subsequently recovered for SBF-SEM and volumetric 3D reconstruction to characterize ultrastructural anatomy. In this study, we continued to extract ultrastructural information from the dendrites imaged in vivo, focusing on postsynaptic mitochondria. To identify postsynaptic mitochondria, we used an unsupervised method for 3D identification of mitochondria in the EM volumes (see Methods). This method quickly and accurately identified mitochondria within the dendritic shaft (Figure 1A). From these 3D annotations, we first characterized the basic structure and organization of postsynaptic mitochondria in our dataset (n=324 mitochondria identified within 63 dendritic segments from 4 cells collected from 2 animals).
Figure 1
Volumetric characterization of postsynaptic mitochondria in L2/3 pyramidal neurons of ferret visual cortex.
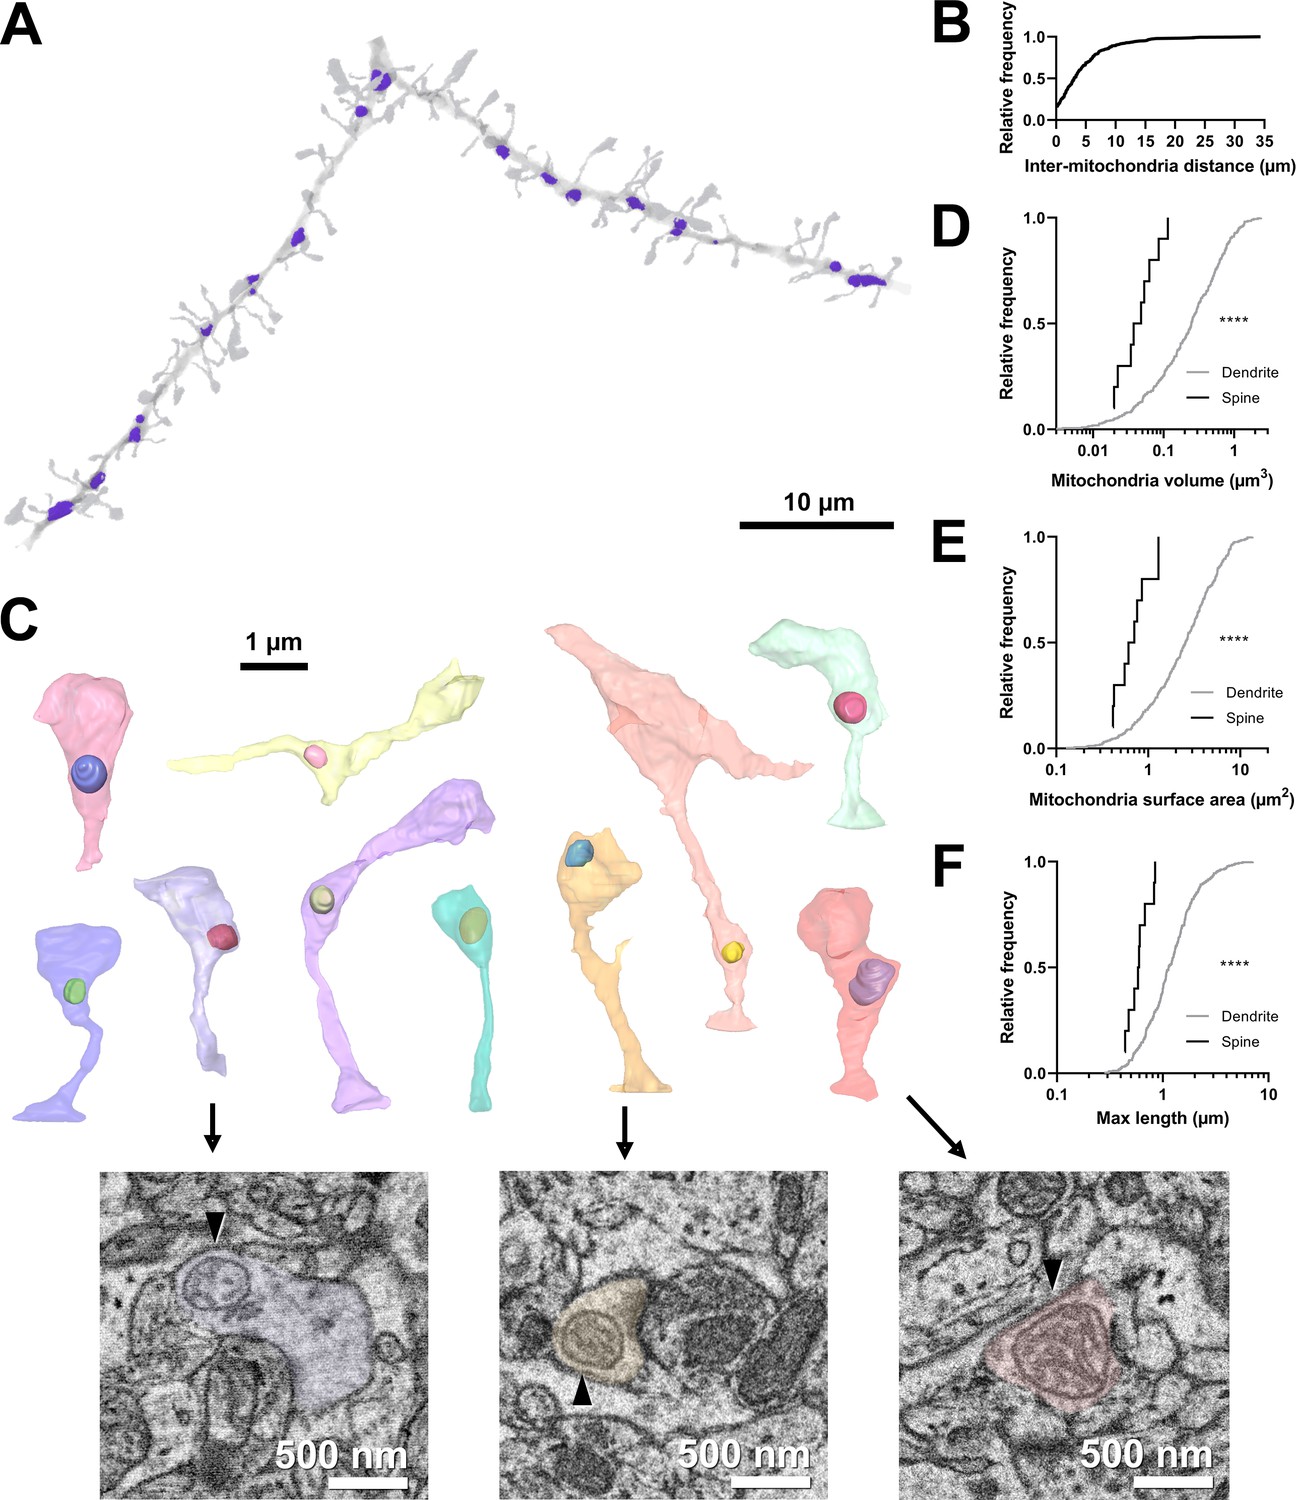
(A) Example electron microscopy (EM) reconstruction of a dendrite with mitochondria (purple). (B) Cumulative frequency distribution of inter-mitochondria distance. (C) EM reconstructions of all functionally characterized spines that contain mitochondria in the head or neck of the spine. Mitochondria were observed either fully within the head, at the base of the head near the opening of the neck, or in the neck. Electron micrographs show cross sections through three example spines having mitochondria (arrowheads) at the base of the head (purple), fully within the head (yellow), or in the neck (pink). (D) Cumulative frequency distribution of mitochondria volume, comparing mitochondria found in dendrites (gray) versus those found in spines (black). (E) Mitochondria surface area. (F) Maximum mitochondria length. Mann-Whitney U tests; ****p<0.0001.
Mitochondria were distributed throughout dendrites, with infrequent, large (>10 µm) gaps between individual mitochondria (median inter-mitochondrion distance = 3.025 µm, IQR = 5.281 µm, Figure 1A and B). Mitochondria in the basal dendrites of ferret layer 2/3 cortical cells were typically small (median volume = 0.248 µm3, IQR = 0.443 µm3, surface area = 2.537 µm2, IQR = 3.144 µm2, Figure 1D–E), with a short length through the dendrite (maximum length median = 1.137 µm, IQR = 0.881 µm, Figure 1F), in comparison to many in vitro and in vivo reports of mouse cortical neurons (Lewis et al., 2018). While most mitochondria were positioned within the dendritic shaft, we did observe a small fraction of mitochondrion positioned either inside the spine neck or head (4.9%, 10/203 spines, Figure 1C). Of these spines, mitochondria were found entirely within the spine head (2/10), at the junction between the head and neck (5/10), or within the neck (3/10). Mitochondria in spines were significantly smaller and more spherical in shape than dendritic mitochondria (median volume = 0.050 µm3, IQR = 0.047 µm3, surface area = 0.658 µm2, IQR = 0.540 µm2, maximum length = 0.590 µm, IQR = 0.249 µm; all p<0.0001, Mann-Whitney U tests; Figure 1D–F). These mitochondria were never continuations of dendritic mitochondria.
Dendritic mitochondria organization is independent of dendritic spine morphology
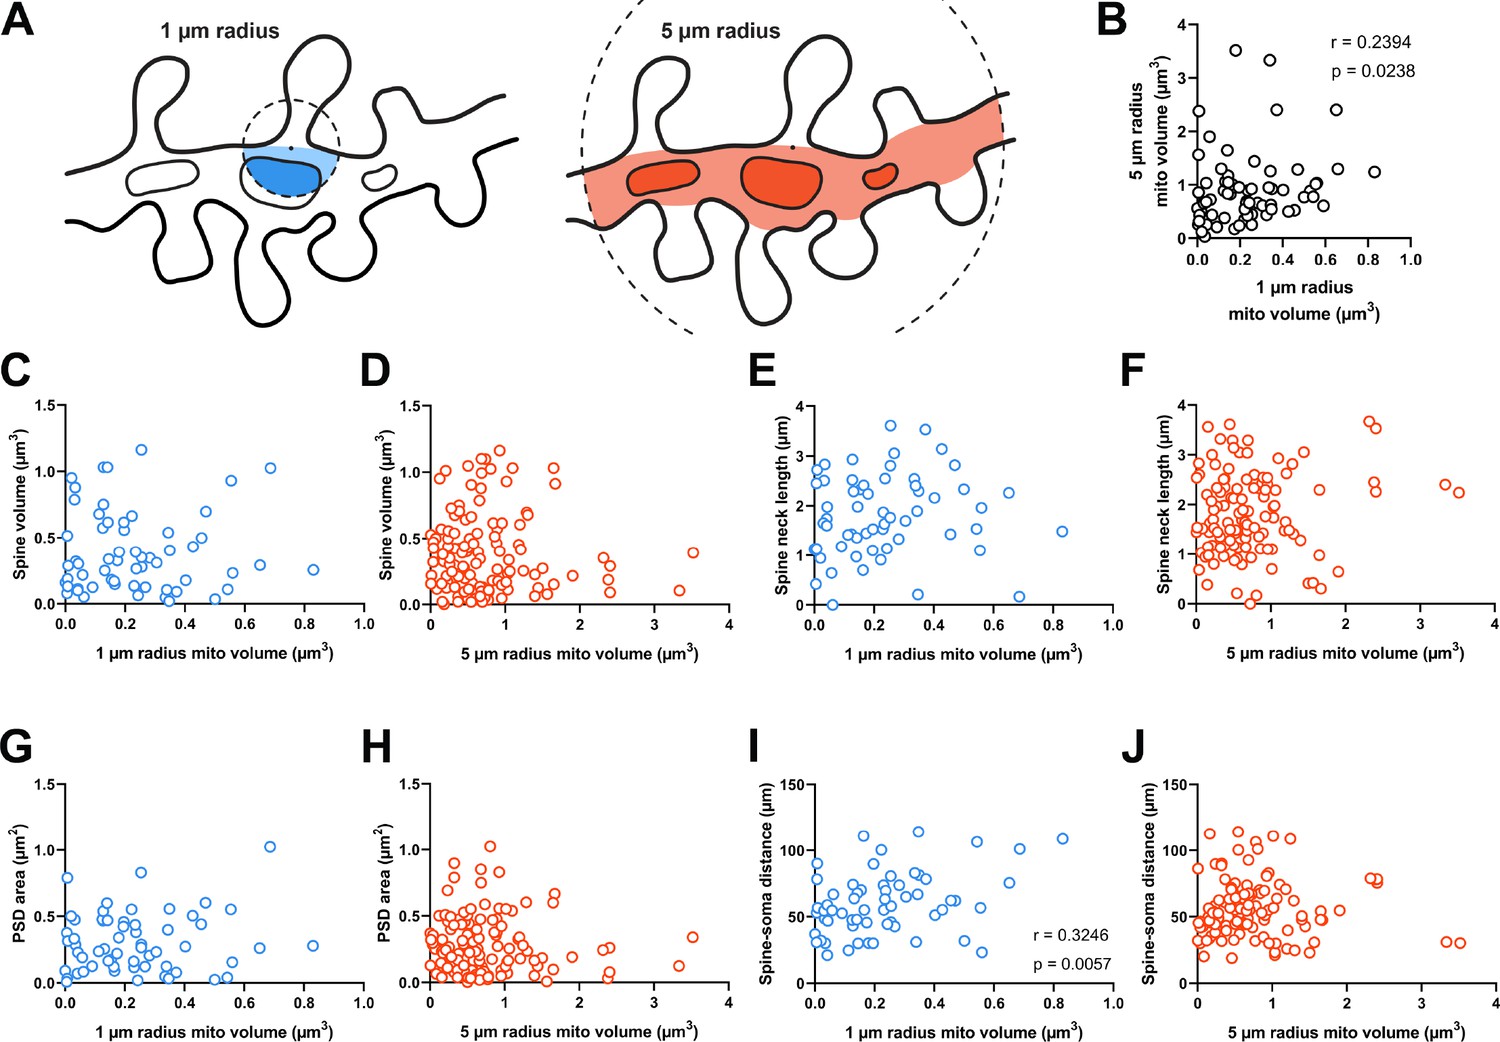
We hypothesized that dendritic mitochondria are strategically positioned to support synapses on dendritic spines in a structural- or activity-dependent manner, as observed for axons (Smith et al., 2016). To test this hypothesis, we measured the total mitochondria volume within a given distance from the base of the spine neck (Figure 2A). We chose this metric over measuring distance to the nearest mitochondrion for three reasons: (1) distance to a mitochondrion is ill defined and could be measured from either the center of mass or nearest membrane, (2) larger mitochondria produce more ATP and provide a greater capacity for calcium buffering to support nearby synapses, and (3) multiple mitochondria were occasionally clustered nearby individual spines. In presynaptic boutons, a critical inflection-point distance has been identified, where the presence of a mitochondrion less than 3 µm from the synapse results in an increase in active zone size and docked vesicle number (Smith et al., 2016). Based on this observation, we measured mitochondria volume using two radii: 1 µm and 5 µm (Figure 2A). In our dataset, the median spine neck length is roughly 1.8 µm; therefore, 1 µm and 5 µm distances represent short and extended ranges relative to the synapse. In our population, 56.8% of spines had no mitochondria volume within 1 µm and 12.1% of spines had none within 5 µm. Expectedly, there was greater mitochondria volume for a 5 µm radius compared to 1 µm nearby individual spines (1 µm radius median volume = 0.221 µm3, IQR = 0.278 µm3; 5 µm radius median volume = 0.771 µm3, IQR = 0.561 µm3; n=69 spines, p<0.001, Mann-Whitney U test), although these two measures were significantly correlated (Spearman’s r=0.239, p=0.0238; Figure 2B). For all subsequent analyses unless otherwise stated, we focused only on spines with measurable mitochondrial volume within each radius.
Figure 2
Dendritic mitochondria are positioned to support a diversity of anatomical strengths.
(A) Schematic illustration of the method used to measure dendritic mitochondria volume near structurally and functionally characterized spines in electron microscopy (EM) reconstructions. A sphere of a short (1 µm, blue) or extended radius (5 µm, orange) from the base of the spine neck (black dot) was used to sample the nearby volume of mitochondria for each spine. (B) Correlation plot of the volume of mitochondria present within short and extended radii for individual spines. Only spines that had dendritic mitochondria within 5 µm were considered. (C, D) Correlation of spine volume and mitochondria volume within a short or extended distance. (E, F) Correlation of spine neck length and mitochondria volume. (G, H) Correlation of postsynaptic density (PSD) area and mitochondria volume. (I, J) Correlation of the distance between a spine/soma and mitochondria volume. r=Spearman’s correlation coefficient. Correlation plots exclude spines that have zero mitochondria volume within the corresponding measurement radius.
Dendritic spines differ in shape and size (e.g. Figure 1B). As spine structure is highly correlated with synaptic strength (Bartol et al., 2015; Holler et al., 2021), we examined whether mitochondria were preferentially located nearby stronger or weaker synapses, focusing on spines without a mitochondrion in the head or neck. Spine head volume and postsynaptic density (PSD) area, features that are positively correlated with synapse strength, were uncorrelated with mitochondria volume in a 1 µm radius (spine head volume: r=–0.032, p=0.403, n=60; PSD area: r=0.066, p=0.309, n=60 spines; Figure 2C and G) or a 5 µm radius (spine head volume: r=–0.034, p=0.357, n=121; PSD area: r=–0.072, p=0.216, n=121 spines; Figure 2D and H). Spine neck length was also uncorrelated with mitochondria volume at both radii (1 µm: r=0.185, p=0.079, n=60 spines; 5 µm: r=0.040, p=0.333, n=121 spines; Figure 2E and F). We did observe a positive correlation between local 1 µm radius mitochondria volume and the distance of a dendritic spine from the cell body (r=0.325, p=0.006, n=60 spines; Figure 2I). While this relationship was not observed for mitochondria within a 5 µm radius (5 µm: r=0.104, p=0.129, n=121 spines; Figure 2J), there is a simple explanation: the volume fraction of dendrite occupied by mitochondria increases with distance from the soma (Turner et al., 2022). Dendrites are thicker near the soma and possess few dendritic spines.
Dendritic mitochondria are positioned near dendritic spines with diverse visual response properties
As dendritic mitochondria position was unrelated to anatomy, we next considered the visually driven calcium activity of individual dendritic spines. In ferret V1, neurons and dendritic spines have exquisite response specificity to the orientation of drifting gratings (Wilson et al., 2016). Somatic orientation tuning is thought to arise from the co-activation of inputs sharing similar tuning (Scholl et al., 2021). Given the importance of co-tuned inputs supporting somatic selectivity, we hypothesized that dendritic mitochondria would be strategically positioned for energetic support and maintenance of co-tuned inputs.
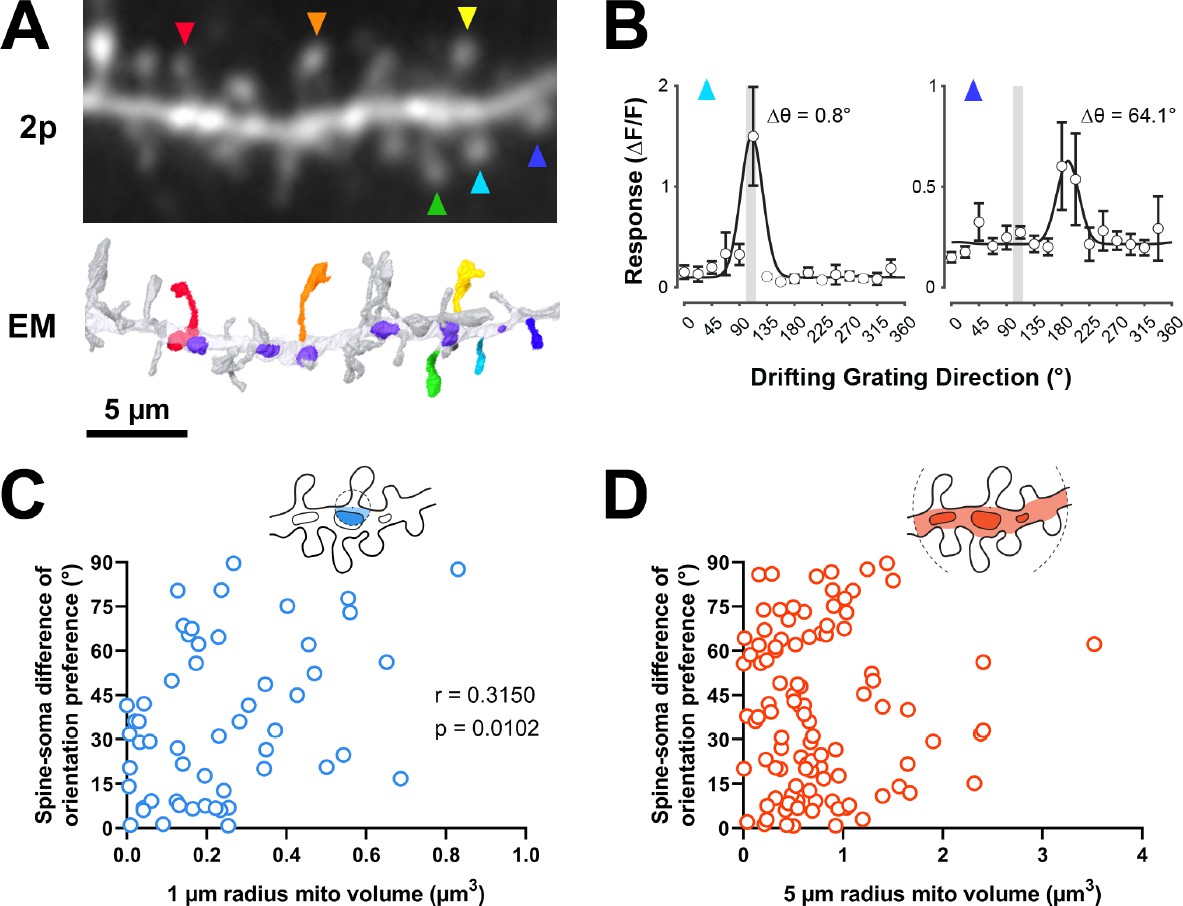
To test this hypothesis, we examined spines in our EM volumes which were also captured by in vivo two-photon calcium imaging during the presentation of oriented drifting gratings (Figure 3A). As previously described (Scholl et al., 2021), evoked calcium signals were measured to characterize the orientation tuning of individual dendritic spines and the corresponding somatic output (Figure 3B). Each of the four cells in our dataset was similarly tuned for orientation (selectivity range = 0.40–0.57, mean = 0.46 ± 0.08 s.d.). For each tuned spine (selectivity >0.1, n=148/164 spines; see Methods), we calculated orientation preference and compared this value to the orientation tuning of each parent soma (∆ϴpref; see Methods). As shown in Figure 3B, spines can be co-tuned with the soma or differentially tuned. We found that mitochondrial volume within a 1 µm radius was correlated with difference in orientation preference relative to the soma (bootstrapped spearman’s r=0.315 ± 0.11 s.e.m., p=0.010, n=54 spines; Figure 3C). This relationship could not be attributed to different properties of co-tuned (∆ϴpref <22.5°, n=68) and differentially tuned spines (∆ϴpref >67.5°, n=30) (selectivity: p=0.12, max response amplitude: p=0.58). When increasing the radius to 5 µm, however, no correlation was observed (bootstrapped Spearman’s r=0.017 ± 0.10 s.e.m., p=0.432, n=107 spines; Figure 3D). This trend was found for all four cells examined (1 µm: mean Spearman’s r=0.49 ± 0.22 s.d.; 5 µm: mean Spearman’s r=0.09 ± 0.13 s.d.). We also considered other spine response properties related to tuning preference; specifically, orientation selectivity and response amplitude at the preferred orientation. For either metric, we observed no relationship to mitochondria within 1 µm radius (selectivity: 1 µm: Spearman’s r=–0.081, p=0.269, n=60; max response amplitude: 1 µm: Spearman’s r=–0.179, p=0.078, n=64) but did see a weak, significant relationship to both at a 5 µm radius (selectivity: Spearman’s r=0.175, p=0.027, n=121; max response amplitude: Spearman’s r=−0.166, p=0.030, n=129). This weak relationship suggests that within some dendritic segments, a greater volume of mitochondria leads to rapid removal of calcium out of the spine and cytoplasm, in agreement with a recent modeling study (Leung et al., 2021).
Figure 3
Dendritic mitochondria are positioned to support spines with a diversity of orientation tuning.
(A) Two-photon average projection image of a short segment of GCaMP6s-labeled dendrite and the corresponding electron microscopy (EM) reconstruction. Functionally characterized spines are indicated with rainbow colors/arrows, mitochondria in the EM reconstruction are purple. (B) Peak ΔF/F responses in response to visual stimulus for two example spines shown in A (teal and indigo), showing two different orientation preferences. The teal spine has a preference that is aligned with the average preference of the soma (vertical gray bar), while the indigo spine has a preference that is dissimilar to the soma. Spine data are mean ± s.e.m. (n=8 stimulus trials). (C, D) Correlation of spine-soma difference of orientation preference and mitochondria volume for short (1 µm, blue) and extended (5 µm radius, orange) distances from the base of a spine. r=Spearman’s correlation coefficient. Correlation plots exclude spines that have zero mitochondria volume within the corresponding measurement radius.
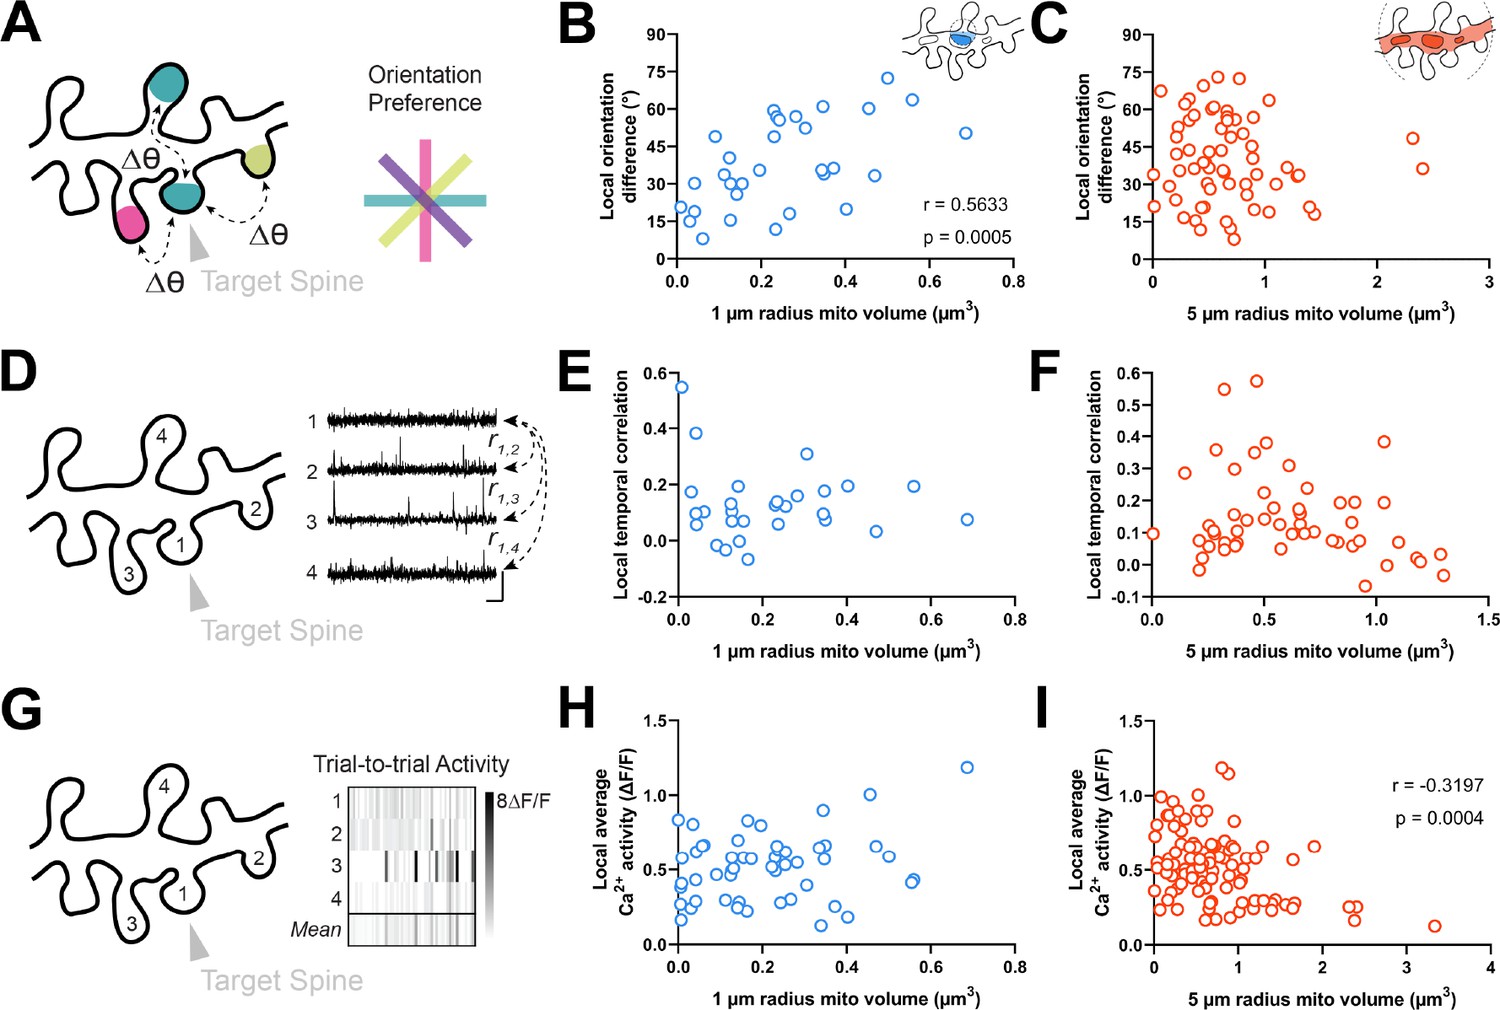
We next wondered whether mitochondria might be positioned near clusters of spines with diverse orientation preferences. Within the same dendritic segment, local populations of spines can either share the same orientation (homogeneous; Scholl et al., 2017) or exhibit diversity (heterogeneous; Wilson et al., 2016). We measured the average orientation difference (i.e. local heterogeneity) of all spines within a 5 µm neighborhood of a given spine (Figure 4A; see Methods). We choose 5 µm because this value is strongly associated with the spatial extent of synaptic clustering and provides adequate sample sizes for computing the average orientation differences (n>2 spines). Similar to spine-soma difference in orientation preference, we found that local heterogeneity was strongly correlated with mitochondria volume within a 1 µm radius (r=0.563, p=0.0005, n=31 spines; Figure 4B), and not within 5 µm (r=0.017, p=0.432, n=107 spines; Figure 4C). Importantly, while local heterogeneity was correlated with spine co-tuning (circular r=0.33, p=0.0024, n=100 spines), this correlation was entirely due to inputs that closely matched the somatic preference. Restricting to only differentially tuned inputs (∆ϴpref >11.25°) yielded no correlation between spine-soma similarity and local heterogeneity (circular r=0.03, p=0.82, n=71 spines). Focusing on these spines, local heterogeneity was still strongly correlated with mitochondria volume within 1 µm (Spearman’s r=0.52, p=0.0052, n=50).
Figure 4
Dendritic mitochondria are positioned locally in regions having diverse synaptic orientation preferences and broadly in areas of low local Ca2+ activity.
(A) Illustration of average difference in orientation preference between a target spine (arrowhead) and neighboring spines within 5 µm. (B, C) Correlation of local orientation difference and mitochondria volume for short (1 µm, blue) and extended (5 µm radius, orange) distances form the base of a spine. (D) Illustration of average local temporal correlation of spines within 5 µm of the target spine. Scale bar is 1 s and 100% ΔF/F. (E, F) Correlation of local temporal correlation and mitochondria volume. (G) Illustration of local Ca2+ activity, shown as mean trial-to-trial ΔF/F, within 5 µm of the target spine. (H, I) Correlation of local average Ca2+ activity and mitochondria volume. r=Spearman’s correlation coefficient. Correlation plots exclude spines that have zero mitochondria volume within the corresponding measurement radius.
Our data show that dendritic mitochondria are not observed near co-tuned spines or homogeneous clusters, but these measurements are based on orientation tuning preference, a metric that does not necessarily reflect local synaptic activity. Thus, we wondered whether a similar relationship exists for correlated activity between spines or the total calcium activity from groups of spines. As functional similarity coincides with spine co-activity (Scholl et al., 2017), dendritic mitochondria should not be positioned near spines with greater co-activity or total activity. We examined both the average local temporal correlation of calcium activity (Figure 4D) and trial-by-trial average calcium activity for all spines within a 5 µm radius of a given spine (Figure 4G; see Methods). Local temporal correlation was calculated using the average Pearson correlation coefficient of time-varying ΔF/F traces between a target spine and all neighboring spines within 5 µm. We found no relationship for either measurement within a 1 µm radius (local temporal correlation: r=0.015, p=0.469, n=28 spines; local average calcium activity: r=0.160, p=0.131, n=51 spines; Figure 4E and H), nor for local temporal correlation at a 5 µm radius (r=–0.152, p=0.141, n=52 spines; Figure 4F). We did, however, observe a considerable negative correlation between mitochondria volume within a 5 µm radius and local average calcium activity (r=–0.320, p=0.0004, n=105 spines; Figure 4I). As this correlation was only observed at an extended radius, it suggests that dendritic regions with a particularly large volume of mitochondria, calcium is quickly buffered and calcium activity is attenuated within dendritic spines.
Dendritic spines with mitochondria are large and have high tuning selectivity
Our analyses have revealed that dendritic mitochondria are proximal to differentially tuned spines and dendritic regions of local heterogeneity. These analyses have excluded dendritic spines containing mitochondria in the spine neck or head (Figure 1C). We then examined whether these unique spines (n=10) displayed distinct structural or functional properties.
Spines with a mitochondrion in the head or neck had a significantly larger spine head volume compared to the majority of spines that do not (mito+: median = 0.608 µm3, n=10 spines; mito–: median = 0.311 µm3, n=157 spines, p=0.0014, Mann-Whitney U test, p=0.01, permutation test; Figure 5A). A similar trend was observed for PSD area, but it was not significant (mito+: median = 0.396 µm2, n=10 spines; mito–: median = 0.244 µm2, n=157 spines, p=0.087, Mann-Whitney U test, p=0.12, permutation test; Figure 5B). Other anatomical properties such as spine neck length (mito+: median = 1.850 µm, n=10 spines; mito–: median = 1.65 µm, n=157 spines, p=0.382, Mann-Whitney U test, p=0.14, permutation test; Figure 5C) and distance of the spine from the soma (mito+: median = 52.32 µm, n=10 spines; mito–: median = 50.56 µm, n=157 spines, p=0.898, Mann-Whitney U test, p=0.42, permutation test; Figure 5D) showed no difference between spine groups. Given the difference in size between spines with and without a mitochondrion, we wondered about spines nearby a dendritic mitochondrion (within 1 µm, n=65) compared to those with no measurable mitochondria within 5 µm (n=19). For these groups, we found no difference in spine volume (within 1 µm: median = 0.29 µm3, IQR = 0.41 µm3; no mitochondria within 5 µm: median = 0.40 µm3, IQR = 0.37 µm3; Mann-Whitney ranksum test, p=0.67) or PSD area (within 1 µm: median = 0.26 µm2, IQR = 0.33 µm2; no mitochondria within 5 µm: median = 0.31 µm2, IQR = 0.36 µm2; Mann-Whitney ranksum test, p=0.49).
Figure 5
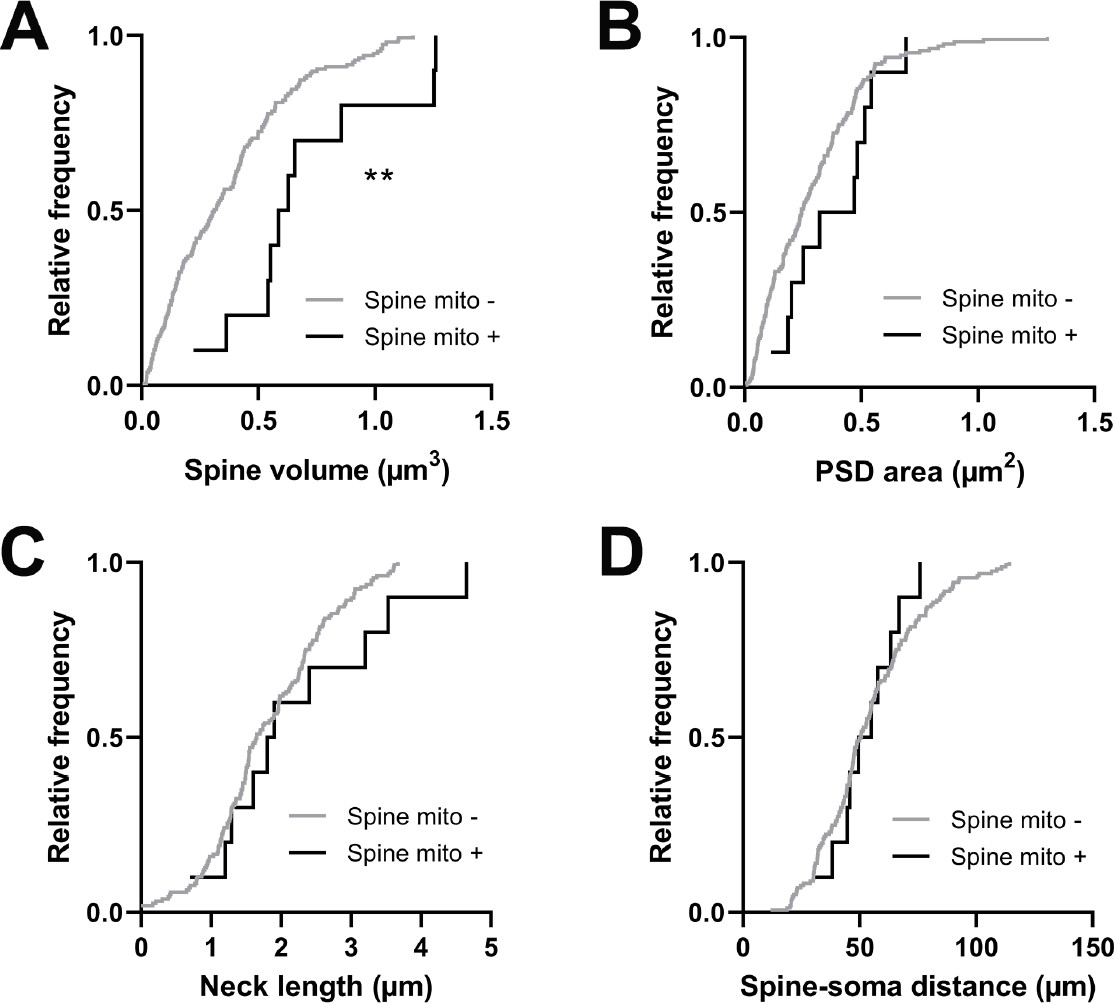
Spines having a mitochondrion in the head or neck are larger.
(A) Cumulative frequency distribution of spine head volume for spines that have a mitochondrion in the head or neck (black, n=10 spines, shown in Figure 1C) versus spines that do not (gray). (B) PSD area. (C) Neck length. (D) Distance between the spine and soma. Mann-Whitney U tests, **p<0.01.
Comparing other functional response properties, we found only a single metric showing a significant difference: orientation tuning selectivity. Spines with a mitochondrion were more selective for oriented gratings (mito+: median = 0.396, n=10 spines; mito–: median = 0.268, n=161 spines, p=0.016, Mann-Whitney U test, p=0.03, permutation test; Figure 6A). Unlike for dendritic mitochondria, we saw no difference in spine-soma difference of orientation preference (mito+: median = 10.62, n=10 spines; mito–: median = 30.17, p=0.451, n=146 spines, Mann-Whitney U test, p=0.23, permutation test; Figure 6B). Again, we made a similar examination of spines near dendritic mitochondria and those without mitochondria within 5 µm. We found no difference orientation selectivity (1 µm: median = 0.29, IQR = 0.28; no mitochondria within 5 µm: median = 0.28, IQR = 0.15; Mann-Whitney ranksum test, p=0.74) or mismatch to soma orientation (1 µm: median = 0.54°, IQR = 0.86°; no mitochondria within 5 µm: median = 0.46°, IQR = 0.47°; Mann-Whitney ranksum test, p=0.75). Taken together, these data suggest that mitochondria positioned within dendritic spines may serve a different purpose than those within the dendrites, supporting stronger synaptic inputs, which have been shown to be more selective for features of visual stimuli (Scholl et al., 2021).
Figure 6
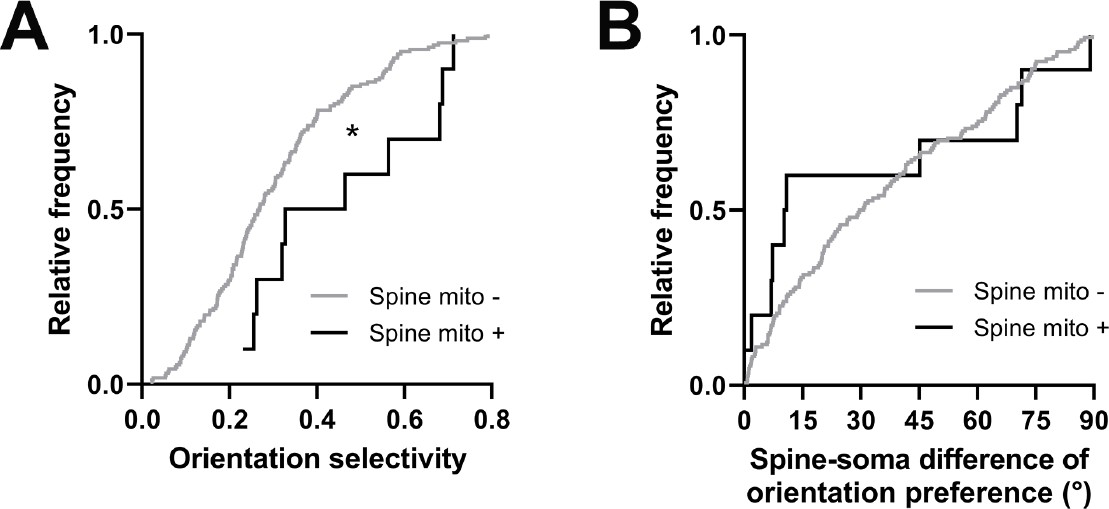
Spines having a mitochondrion in the head or neck are more selective for visual features.
(A) Cumulative frequency distribution of orientation selectivity for spines that have a mitochondrion in the head or neck (black, n=10 spines, shown in Figure 1C) versus spines that do not (gray). (B) Spine-soma difference of orientation preference. Mann-Whitney U tests, *p<0.05.
Discussion
We used a correlative light and EM dataset (Scholl et al., 2021) to characterize mitochondria within basal dendrites of L2/3 pyramidal neurons of the ferret V1 and relate their abundance near spines to an array of ultrastructural and functional properties of those spines. Based on 3D reconstructions using deep learning segmentation, mitochondria were found throughout the dendrites and had a fragmented morphology similar to those observed recently in CA1 pyramidal neuron basal dendrites (Virga et al., 2023). We report no relationship to measures of synaptic strength such as spine head volume or PSD area to dendritic mitochondrial volume within either a short or extended (1 µm or 5 µm, respectively) distance from the base of the spine neck. We did observe significant correlations between the volume of nearby mitochondrial and functional diversity – for spine orientation preference similarity to the soma and for local dendritic orientation preference heterogeneity. We also found that spines having mitochondria within the head or neck have significantly larger heads than those that do not and are more selective for visual stimuli, but are no different in other measures of structure and function. Taken together, our results point toward a system where dendritic mitochondria are positioned to support functional diversity, but not synaptic strength as has been previously shown in the presynaptic terminal. Furthermore, though rare, mitochondria within spines do support synaptic strength and selectivity, suggesting that mitochondria are flexible to support different facets of postsynaptic signaling depending on the compartment in which they are present.
Mitochondria and dendritic spine anatomy
In this study, we investigated whether dendritic mitochondria are preferentially positioned to support certain populations of dendritic spines over others, based on their structural or sensory-driven activity. We were surprised to find that dendritic mitochondria were not positioned near strong synapses, as measured by spine volume or PSD area. Considering that postsynaptic glutamate receptors are estimated to take up 46% of the O2 consumed by oxidative phosphorylation, and that larger spines have greater quantities of receptors (Holtmaat and Svoboda, 2009; Hall et al., 2012), we assumed that mitochondria would need to be positioned nearby for oxidative support. This is in contrast to studies of the presynapse: presynaptic terminal active zone area and mitochondria volume are strongly correlated, and mitochondria proximity is correlated with the number of nearby docked vesicles (Smith et al., 2016; Thomas et al., 2019). Our results suggest that dendritic mitochondria are not necessarily positioned to support the energy needs of large spines (i.e. strong synapses) through oxidative phosphorylation, at least in the pyramidal neuron basal dendrites we observed, and opens new questions into the nature of mitochondria.
Mitochondria and spine functional properties
We hypothesized that dendritic mitochondria would be positioned near synaptic inputs co-tuned with the somatic output (i.e. similar orientation preference). Our rationale was that co-activation of co-tuned inputs are critical for shaping somatic selectivity, and these inputs can often be found to be clustered together to trigger nonlinear dendritic events (Wilson et al., 2016; Scholl et al., 2021; Scholl et al., 2017). Surprisingly, we found the opposite: mitochondria are present in greater volumes near differentially tuned spines. This includes spines that had an orientation preference mismatching the soma and spines within dendritic regions of heterogeneity in orientation preference. What might be the cause of such a striking deviation from our original hypothesis?
One possibility is that regions of high spine functional diversity are undergoing plasticity, such as spine pruning, de novo formation, or strength modifications. Recent in vivo studies have demonstrated that mitochondria are recruited to dendritic regions undergoing structural dynamics (Faits et al., 2016; Dromard et al., 2021); however, it is unclear whether this is the case for our own EM dataset as we were only able to study a single developmental time point (adolescent, visually mature ferret). Another possibility is that differentially tuned spines and heterogeneous clusters reside nearby a greater number of GABAergic inputs, supported energetically or buffered by local mitochondria, which could thereby act to sculpt away excitatory input. It is also possible that co-tuned spines will be more co-activated with and infiltrated by back-propagating somatic action potentials (Palmer and Stuart, 2009; Popovic et al., 2015), as compared to differentially tuned spines. Back-propagating action potentials may alter spine head depolarization, PSD composition, or calcium dynamics; differences in spine activation may lead to different levels of support needed from mitochondria. Finally, it is possible that our observations are specific to the ferret or visual cortex. Unfortunately, there are not enough reported measurements of postsynaptic mitochondria to compare between animal models, let alone brain areas, and it remains to be shown if our results will hold for layer 2/3 pyramidal neurons in mouse V1. Nevertheless, as ferrets are a highly visual animal with a primate-like organization of the early visual system, our observations may reflect specific visual processing demands (e.g. extracting motion information from incoming signals).
Of course, there are limitations precluding our ability to assess dendritic spine structure-function relationships. Visual cortical neurons exhibit a high degree of functional heterogeneity and we probed only a single stimulus dimension (orientation). In vivo spine calcium imaging is biased toward larger spines and can only resolve synaptic events involving NMDA receptors or voltage-gated calcium channels (Scholl et al., 2021). Spine calcium signals are likely not to directly reflect underlying electrical signals (Koester and Johnston, 2005; Sobczyk et al., 2005). In addition, the kinetics of GCaMP6s make it difficult to characterize other functional properties of synapses such as activity frequency during visual stimulation. In summary, although we cannot provide a clear reason for our findings, our data highlight the need for greater investigation into dendritic mitochondria, their subcellular organization within cells, and their relationship to patterns of synaptic activity.
Mitochondrial structure and distribution
Several factors influence the size and abundance of neuronal mitochondria including brain region, neuronal compartment, cell type, animal age, and health (Delgado et al., 2019; Glancy et al., 2020). Despite this variability, dendritic mitochondria are generally longer and take up a greater fraction of neurite volume compared to axonal mitochondria, which tend to be more fragmented and, in some cases, more mobile. Previous reports in mouse hippocampal cell culture and rat hippocampus report dendrites with long, overlapping mitochondria that form stable compartments of ~35 µm length or more (Popov et al., 2005; Rangaraju et al., 2019). Studies of mouse cortex using EM or light microscopy report mitochondria lengths of roughly 1–10 µm (Lewis et al., 2018; Turner et al., 2022). Our results are closer to those of mouse cortex, but are smaller (median length just over 1 µm, 10th percentile = 0.55 µm, 90th percentile = 2.49 µm). The mitochondrial morphology we observe is most similar to a recent report from mouse CA1 pyramidal neuron basal dendrites, where mitochondria are ~1 µm long and have a similar size distribution (Virga et al., 2023). This similarity could be due to the fact that dendritic mitochondrial morphology is cell type and neuronal compartment specific (e.g. apical vs. basal dendrites). Another possibility is that mitochondrial fragmentation, as we observe in layer 2/3 ferret basal dendrites, is linked to synaptic excitability. In support of this hypothesis, Virga et al., 2023 demonstrated that low levels of excitability and activity is linked to longer mitochondria. Thus, presynaptic neurons driving basal synapses in carnivore V1 may operate at relatively high firing rates (Mante et al., 2008), leading to more fragmented mitochondria than compared to mouse V1.
Another variable feature across brain regions is the presence of mitochondria within spines. In hippocampal cell cultures, mitochondria enter about 8–10% of spines, typically as extensions of a dendritic mitochondrion (Li et al., 2004). EM reconstructions of mouse neocortex showed only 0.21% of spines (n=3/1425) contained mitochondria (Kasthuri et al., 2015). In contrast, for olfactory bulb granule cells, ~87% of spines contain mitochondria (Cameron et al., 1991). We found that 4.9% of spines contain mitochondria, however, since we specifically examined layer 2/3 neuron basal dendrites proximal to the soma, it is difficult to ascertain where this value stands within the literature and future studies will need to investigate variations due to brain area, cell type, and compartment. Another interesting distinction in our dataset was that spine mitochondria were roughly spherical or oblong, never continuations of a dendritic mitochondrion. It is likely that these mitochondria are small fragmentations of nearby dendritic mitochondria trafficked into the spine, possibly through interactions with the cytoskeleton (MacAskill and Kittler, 2010), supporting the idea that spine mitochondria serve different role than dendritic mitochondria.
Previous observations in cultured neurons suggest that dendritic mitochondria are stable, and similar evidence has been shown in retinal ganglion cell dendrites from the intact retina (Chang et al., 2006; Faits et al., 2016; Rangaraju et al., 2019). Experiments have also shown that oxidative phosphorylation by mitochondria is needed for dendritic protein translation, not glycolysis (Rangaraju et al., 2019), and that it contributes a majority of the energy consumed at the postsynaptic site by receptor and ion channel activation (Harris et al., 2012). However, taking our observations into account, it’s difficult to conceive such a system could exist where mitochondria are simultaneously immobile and provide significant quantities of energy for synaptic activity through oxidative phosphorylation, yet have no positional bias toward large, strong synapses. We expect there exists a balance between oxidative phosphorylation and glycolysis supplying energy at the synapse. This balance could shift depending on brain region, cell type, compartment, activity level, and mitochondrial morphology and mobility. In this way, dendritic areas receiving synaptic inputs with high functional diversity require greater local mitochondrial ATP production, while baseline activity is supported through local glycolysis or ATP diffusion from more distant sources. Additionally, the role that mitochondria serve at the synapse may shift toward one of calcium buffering and plasticity support. Local depletion of mitochondria has been shown to reduce plasticity (Rangaraju et al., 2019), and by blocking fission, spines have impaired structural and functional long term potentiation (LTP). Induction of LTP causes increased dendritic mitochondrial Ca2+ and a burst of fission (Divakaruni et al., 2018). Thus, once spines become established, mitochondria may localize to input-diverse dendritic regions to support synaptic plasticity. More investigation into the support functions of postsynaptic mitochondria is needed to elucidate their different contributions to synaptic function, plasticity, and development.
Methods
All procedures were performed according to NIH guidelines and approved by the Institutional Animal Care and Use Committee at Max Planck Florida Institute for Neuroscience.
Animals, viral injections, and cranial windows
Information on animals, survival viral injections, cranial window implantation are described in depth in our previous studies (Scholl and Fitzpatrick, 2020; Scholl et al., 2017; Scholl et al., 2021). Briefly, layer 2/3 neurons of the primary visual cortex of female ferrets (n=3, Marshall Farms) were driven to express the calcium indicator GCaMP6s via a Cre-dependent AAV expression system. On the day of imaging, a cranial window was surgically implanted to image calcium activity of cortical pyramidal neurons during presentation of visual stimuli.
Two-photon imaging
Two-photon imaging was performed using a Bergamo II microscope (Thorlabs) running Scanimage (Vidrio Technologies) with 940 nm dispersion-compensated excitation provided by an Insight DS+ (Spectraphysics). For spine and axon imaging, power after the objective was limited to <50 mW. Images were collected at 30 Hz using bidirectional scanning with 512×512 pixel resolution or with custom ROIs (regions of interest; framerate range: 22–50 Hz). Somatic imaging was performed with a resolution of 0.488–0.098 µm/pixel. Dendritic spine imaging was performed with a resolution of 0.164–0.065 µm/pixel.
Visual stimuli
Visual stimuli were generated using Psychopy (Peirce, 2007). The monitor was placed 25 cm from the animal. Receptive field locations for each cell were hand mapped and the spatial frequency optimized (range: 0.04–0.20 cpd). For each soma and dendritic segment, square-wave or sine-wave drifting gratings were presented at 22.5o increments to each eye independently (2 s duration, 1 s ISI, 8–10 trials for each field of view). Drifting gratings of different directions (0 – 315o) were presented independently to both eyes with a temporal frequency of 4 Hz.
Two-photon imaging analysis
Imaging data were excluded from analysis if motion along the z-axis was detected. Dendrite images were corrected for in-plane motion via a 2D cross-correlation-based approach in MATLAB or using a piecewise non-rigid motion correction algorithm (Pnevmatikakis and Giovannucci, 2017). ROIs were drawn in ImageJ; dendritic ROIs spanned contiguous dendritic segments and spine ROIs were fit with custom software. Mean pixel values for ROIs were computed over the imaging time series and imported into MATLAB. ΔF/F was computed with a time-averaged median or percentile filter (10th percentile). We subtracted a scaled version of the dendritic signal to remove back-propagating action potentials as performed previously (Wilson et al., 2016). ΔF/F traces were synchronized to stimulus triggers sent from Psychopy and collected by Spike2.
Peak responses to bars and gratings were computed using the Fourier analysis to calculate mean and modulation amplitudes for each stimulus presentation, which were summed together. Spines were included for analysis if the mean peak for the preferred stimulus was >10%, the SNR at the preferred stimulus was >1, and spines were weakly correlated with the dendritic signal (Spearman’s correlation, r<0.4). Some spine traces contained negative events after subtraction, so correlations were computed ignoring negative values. Preferred orientation for each spine was calculated by fitting responses with a double Gaussian tuning curve (Wilson et al., 2016) using lsqcurvefit (MATLAB). Orientation selectivity was computed by calculating the vector strength of mean responses (Wilson et al., 2016).
For each tuned spine (orientation selectivity >0.1), we calculated orientation preference difference between the spine and parent soma as in Wilson et al., 2016. To measure the average orientation difference (i.e. local heterogeneity), we calculated the orientation preference difference between a target spine and all surrounding spines within 5 µm on the same dendrite. For targets with n>2 neighbors, we then computed the circular mean. Average spatiotemporal correlation for a given spine was calculated similarly: the Pearson correlation between time-varying ΔF/F traces was computed between a target spine and all neighbors within 5 µm, and then we calculated the average of this population. To calculate trial-by-trial average calcium activity, we averaged the amplitudes of evoked calcium transients between a target spine and neighbors within 5 µm for all visual stimulus trials. A grand mean was then computed across all trials.
Perfusion, fixation, and slice preparation for fluorescence imaging
Anesthetized animals were immediately perfused with 2% paraformaldehyde and 2–2.5% glutaraldehyde in a 0.1 M sodium cacodylate buffer (pH 7.4). Following removal, brains were sliced at 80 µm parallel to the area flattened by the cranial window. Slices were quickly imaged at low magnification (×20, 0.848×0.848 µm/pixel) using a Leica CLSM TCS SP5 II running LAS AF (ver. 3.0, Leica) with 488 nm laser excitation. Fluorescence of GCaMP6s was used to locate the target cell in this view. Autofluorescence resulting from glutaraldehyde fixation also produced signal within the tissue slices. A field of view large enough to cover roughly one-fourth of the slice, with the target cell included, was captured using image tiling. This process was performed to identify the fluorescent cell of interest and for slice-level correlation in later steps of the workflow. The slice containing the target cell was then imaged with the same ×20 objective at higher pixel resolution (0.360×0.360×0.976 µm/voxel) to obtain a z-stack of the full depth of the slice and immediate region surrounding the target cell. CLSM imaging required approximately 1–3 hr to find the cell of interest within a slice and capture a tiled slice overview and higher resolution z-stack.
Sample preparation for SBF-SEM imaging
Samples were prepared as previously described (Scholl et al., 2021; Thomas et al., 2021). Briefly, tissue pieces were incubated in an aqueous solution of 2% osmium tetroxide buffered in 0.1 M sodium cacodylate for 45 min at room temperature (RT). Tissue was not rinsed and the osmium solution was replaced with cacodylate buffered 2.5% potassium ferrocyanide for 45 min at RT in the dark. Tissue was rinsed with water 2×10 min, which was repeated between consecutive steps. Tissue was incubated at RT for 20 min in aqueous 1% thiocarbohydrazide dissolved at 60°C, aqueous 1% osmium tetroxide for 45 min at RT, and then 1% uranyl acetate in 25% ethanol for 20 min at RT in the dark. Tissue was rinsed then left in water overnight at 4°C. The following day, tissue was stained with Walton’s lead aspartate for 30 min at 60°C. Tissue was then dehydrated in a graded ethanol series (30%, 50%, 70%, 90%, 100%), 1:1 ethanol to acetone, then 100% dry acetone. Tissue was infiltrated using 3:1 acetone to Durcupan resin (Sigma-Aldrich) for 2 hr, 1:1 acetone to resin for 2 hr, and 1:3 acetone to resin overnight, then flat embedded in 100% resin on a glass slide and covered with an Aclar sheet at 60°C for 2 days. The tissue was trimmed to less than 1×1 mm in size, the empty resin at the surface was shaved to expose tissue surface using an ultramicrotome (UC7, Leica), then turned downward to be remounted to a metal pin with conductive silver epoxy (CircuitWorks, Chemtronics).
SBF-SEM image acquisition and volume data handling
Samples were imaged using a correlative approach as previously described (Thomas et al., 2021). Briefly, tissue was sectioned and imaged using 3View2XP and Digital Micrograph (ver. 3.30.1909.0, Gatan Microscopy Suite) installed on a Gemini SEM300 (Carl Zeiss Microscopy LLC) equipped with an OnPoint BSE detector (Gatan, Inc). The detector magnification was calibrated within SmartSEM imaging software (ver. 6.0, Carl Zeiss Microscopy LLC) and Digital Micrograph with a 500 nm cross line grating standard. A low-magnification image of each block face was manually matched to its corresponding depth in the CLSM Z-stack using blood vessels and cell bodies as fiducials. Final imaging was performed at 2.0–2.2 kV accelerating voltage, 20 µm or 30 µm aperture, working distance of ~5 mm, 0.5–1.2 µs pixel dwell time, 5.7–7 nm per pixel, knife speed of 0.1 mm/s with oscillation, and 56–84 nm section thickness. Acquisition was automated and ranged from several days to several weeks depending on the size of the ROI and imaging conditions. The true section thickness was measured using mitochondria diameter calibrations (Fiala and Harris, 2001). Calibration for each block was required, since variation in thickness can occur due to heating, charging from the electron beam, resin polymerization, and tissue fixation and staining quality (Starborg et al., 2013; Hughes et al., 2014).
Serial tiled images were exported as TIFFs to TrakEM2 (Schindelin et al., 2012) within ImageJ (ver. 1.52p) to montage tiles, then aligned using Scale-Invariant Feature Transform image alignment with linear feature correspondences and rigid transformation (Lowe, 2004). Once aligned, images were inverted and contrast normalized.
SBF-SEM image analysis
Aligned images were exported to Microscopy Image Browser (ver. 2.51, 2.6, Belevich et al., 2016) for segmentation of dendrites, spines, PSDs, and boutons. Three annotators preformed segmentation and the segmentations of each annotator were proofread by an experienced annotator (~1000 hr of segmentation experience) prior to quantification. Binary labels files were imported to Amira (ver. 6.7, 2019.1, Thermo Fisher Scientific) which was used to create 3D surface models of each dendrite, spine, and PSD. Once reconstructed, the model of each dendrite was manually overlaid onto its corresponding two-photon image using Adobe Photoshop for re-identification of individual spines. Amira was used to measure the volume of spine heads, surface area of PSDs, and spine neck length.
For mitochondrial analyses, segmentations were moved into ORS Dragonfly (ver. 2021.3, 2022.1). Within Dragonfly, a pre-built U-net++ architecture was trained on a small set of manual mitochondria segmentations, then applied for segmentation of all mitochondria within target dendrites. Dendrite segmentations were used as a mask to apply the trained mitochondria network, and mitochondria segmentations were proofread for accuracy. Mitochondria morphology was measured using tools within Dragonfly, while inter-mitochondria distances were measured in Microscopy Image Browser using the measure tool. For quantification of mitochondria volume near spines, a sphere of either 1 µm or 5 µm radius was applied with the center at the base of each spine neck, and the volume of mitochondria intersected by each sphere was measured. Mitochondria within spines were segmented manually and these spines (n=10) were not included in correlation analyses. In addition, analyses excluded spines with 0 µm3 mitochondrial volume within the relevant radii unless otherwise stated.
Statistics
Statistical analyses are described in the main text and in figure legends. We used non-parametric statistical analyses (Wilcoxon signed-rank test, Mann-Whitney ranksum test) or permutation tests to avoid assumptions about the distributions of the data. Permutation tests used equivalent sample sizes for each distribution and compared data to the null hypothesis. Statistical analysis was performed in MATLAB (2021b) or GraphPad Prism (ver. 9). Circular correlation coefficients were computed for tests with circular variables. For all other tests, Spearman’s correlation coefficient was computed. All correlation significance tests were one-sided. Quantitative approaches were not used to determine if the data met the assumptions of the parametric tests.
Data availability
Source data for all data figures is publicly available (Zenodo).
-
ZenodoPostsynaptic mitochondria are positioned to support functional diversity of dendritic spines.https://doi.org/10.5281/zenodo.10278270
References
-
An energy budget for signaling in the grey matter of the brainJournal of Cerebral Blood Flow and Metabolism 21:1133–1145.https://doi.org/10.1097/00004647-200110000-00001
-
Mitochondrial trafficking to synapses in cultured primary cortical neuronsThe Journal of Neuroscience 26:7035–7045.https://doi.org/10.1523/JNEUROSCI.1012-06.2006
-
Mitochondrial calcium at the synapseMitochondrion 59:135–153.https://doi.org/10.1016/j.mito.2021.04.006
-
Mitochondria at the neuronal presynapse in health and diseaseNature Reviews. Neuroscience 19:63–80.https://doi.org/10.1038/nrn.2017.170
-
The functional impact of mitochondrial structure across subcellular scalesFrontiers in Physiology 11:541040.https://doi.org/10.3389/fphys.2020.541040
-
Experience-dependent structural synaptic plasticity in the mammalian brainNature Reviews. Neuroscience 10:647–658.https://doi.org/10.1038/nrn2699
-
Systems modeling predicts that mitochondria ER contact sites regulate the postsynaptic energy landscapeNPJ Systems Biology and Applications 7:26.https://doi.org/10.1038/s41540-021-00185-7
-
Distinctive image features from scale-invariant keypointsInternational Journal of Computer Vision 60:91–110.https://doi.org/10.1023/B:VISI.0000029664.99615.94
-
Control of mitochondrial transport and localization in neuronsTrends in Cell Biology 20:102–112.https://doi.org/10.1016/j.tcb.2009.11.002
-
Membrane potential changes in dendritic spines during action potentials and synaptic inputThe Journal of Neuroscience 29:6897–6903.https://doi.org/10.1523/JNEUROSCI.5847-08.2009
-
The role of mitochondrially derived ATP in synaptic vesicle recyclingThe Journal of Biological Chemistry 290:22325–22336.https://doi.org/10.1074/jbc.M115.656405
-
PsychoPy--Psychophysics software in PythonJournal of Neuroscience Methods 162:8–13.https://doi.org/10.1016/j.jneumeth.2006.11.017
-
NoRMCorre: An online algorithm for piecewise rigid motion correction of calcium imaging dataJournal of Neuroscience Methods 291:83–94.https://doi.org/10.1016/j.jneumeth.2017.07.031
-
Electrical behaviour of dendritic spines as revealed by voltage imagingNature Communications 6:8436.https://doi.org/10.1038/ncomms9436
-
Powerhouse of the mind: mitochondrial plasticity at the synapseCurrent Opinion in Neurobiology 57:149–155.https://doi.org/10.1016/j.conb.2019.02.001
-
Quantitative ultrastructural analysis of hippocampal excitatory synapsesThe Journal of Neuroscience 17:5858–5867.https://doi.org/10.1523/JNEUROSCI.17-15-05858.1997
-
Fiji: an open-source platform for biological-image analysisNature Methods 9:676–682.https://doi.org/10.1038/nmeth.2019
-
Cortical synaptic architecture supports flexible sensory computationsCurrent Opinion in Neurobiology 64:41–45.https://doi.org/10.1016/j.conb.2020.01.013
-
NMDA receptor subunit-dependent [Ca2+] signaling in individual hippocampal dendritic spinesThe Journal of Neuroscience 25:6037–6046.https://doi.org/10.1523/JNEUROSCI.1221-05.2005
-
Presynaptic mitochondria volume and abundance increase during development of a high-fidelity synapseThe Journal of Neuroscience 39:7994–8012.https://doi.org/10.1523/JNEUROSCI.0363-19.2019
-
Targeting functionally characterized synaptic architecture using inherent fiducials and 3D correlative microscopyMicroscopy and Microanalysis 27:156–169.https://doi.org/10.1017/S1431927620024757
-
Orientation selectivity and the functional clustering of synaptic inputs in primary visual cortexNature Neuroscience 19:1003–1009.https://doi.org/10.1038/nn.4323
Peer review
Reviewer #1 (Public Review):
Summary:
Mitochondria is the power plant of the cells including neurons. Thomas et al. characterized the distribution of mitochondria in dendrites and spines of L2/3 neurons from the ferret visual cortex, for which visually driven calcium responses of individual dendritic spines were examined. The authors analyzed the relationship between the position of mitochondria and the morphology or orientation selectivity of nearby dendrite spines. They found no correlation between mitochondrion location and spine morphological parameters associated with the strength of synapses, but correlation with the spine-somatic difference in orientation preference and local heterogeneity in preferred orientation of nearby spines. Moreover, they reported that the spines that have a mitochondrion in the head or neck are larger in size and have stronger orientation selectivity. Therefore, they proposed that "mitochondria are not necessarily positioned to support the energy needs of strong spines, but rather support the structurally and functionally diverse inputs."
Strengths:
This paper attempted to address a fundamental question: whether the distribution of the mitochondria along the dendrites of visual cortical neurons is associated with the functions of the spines, postsynaptic sites of excitatory synapses. Two state of the art techniques (2 photon Ca imaging of somata and spines and EM reconstructions of cortical pyramidal neurons) had been used on the same neurons, which provides a great opportunity to examine and correlate the functional properties of spine ultrastructure and spatial distribution of dendritic mitochondria. The conclusion that dendritic mitochondria support functional diversity of spines, but not synaptic strength is surprising and will inspire rethinking the role of mitochondria in synaptic functions.
Weaknesses:
Overall, the findings are intriguing. However, the interpretations of these findings need extra cautions due to the limitations of experimental designs and tools in this study. Neurons in L2/3 of visual cortex are highly diverse in functional properties, which is represented by not only orientation selectivity, but also direction selectivity and spatial/temporal frequency selectivity, etc. The orientation tuning with fixed spatial and temporal frequency may not be the optimal way of stimulating individual synaptic inputs to evaluate synaptic strengths. And the correlation between mitochondria distribution and spine activity evoked by other visual stimulation parameters is worth exploration. Moreover, GCaMP6s measures only spine Ca signals mediated by NMDA and voltage-gated Ca channels, but not sodium currents mediated by ligand-gated or voltage-gated channels. Thus, it reports only some aspects of synaptic properties. Future studies with new tools might help resolve those issues.
https://doi.org/10.7554/eLife.89682.3.sa1Reviewer #2 (Public Review):
Summary:
Mitochondria in synapses are important to support functional needs, such as local protein translation and calcium buffering. Thus, they may be strategically localized to maximize functional efficiency. In this study, the authors examine whether a correlation exists between the positioning of mitochondria and the structure or function of dendritic spines in the visual cortex of a ferret. Unexpectedly, the authors found no correlation between structural measures of synaptic strength to mitochondria positioning, which may indicate that they are not localized only because of the local energy needs. Instead, the authors discover that mitochondria are positioned preferably in spines that display heterogeneous responses, showing that they are localized to support specific functional needs probably distinct from ATP output.
Strengths:
The thorough analysis provides a yet unprecedented insight into the correlation between synaptic tuning and mitochondrial positioning in the visual cortex in vivo.
Weaknesses:
Analysis of this study suggested that mitochondrial volume does not correlate with structural measures of synaptic strength (e.g. spine volume and post-synaptic density (PSD) area), but it remains to be determined if mitochondria localization is also co-related to the frequency of synaptic activity, and what causes the correlation (driven by mitochondrial positioning, or by synaptic activity).
https://doi.org/10.7554/eLife.89682.3.sa2Reviewer #3 (Public Review):
Summary: This is a careful examination of the distribution of mitochondria in the basal dendrites of ferret visual cortex in a previously published volume electron microscopy dataset. The authors report that mitochondria are sparsely, as opposed to continuously distributed in the dendritic shafts, and that they tend to cluster near dendritic spines with heterogeneous orientation selectivity.
Strengths: Volume EM is the gold standard for quantification of organelle morphology. An unusual strength of this particular dataset is that the orientation selectivity of the dendritic spines was measured by calcium imaging prior to EM reconstruction. This allowed the authors to assess how spines with varying selectivity are organized relative to mitochondria, leading to an intriguing observation that they localize to heterogeneous spine clusters. The analysis is carefully performed. An additional strength is the use of a carnivore with a sophisticated visual system.
Weaknesses: Using threshold distances between mitochondria and synapses as opposed to absolute distances may overlook important relationships in the data.
https://doi.org/10.7554/eLife.89682.3.sa3Author response
The following is the authors’ response to the original reviews.
We sincerely thank and express our appreciation to each of the reviewers for their thorough critique of our manuscript.
Reviewer #1 (Recommendations For The Authors):
1. The analysis of whole study comes from only 4 cells from L2/3 of ferret visual cortex; however, it is well known that there is a high level of functional heterogeneity within the cortical neurons. Do those four neurons have similar or different response properties? If the four neurons are functionally different, the weak or no correlation may result from heterogenous distribution pattern of mitochondria associated with heterogenous functionality.
This is an important consideration and often a limitation of CLEM studies. While cortical neurons do exhibit a high degree of functional heterogeneity (similar to spine activity), the 4 cells examined all had selective (OSI > 0.4) somatic responses to oriented gratings, although they differed in their exact orientation preference. Due to experimental limitations of recording from a large population of dendritic spines, we did not characterize other response properties for which their sensitivity might differ. We did not consider orientation preference a metric of study, but instead characterized the difference in preference from the somatic output, allowing comparisons across spines. In addition, our measurements were limited to proximal, basal dendrites rather than any location in the dendritic tree. Nonetheless, we attempted to address this concern by examining spines with functionally heterogenous visual responses within single cells, as reported in our manuscript: mitochondrial volume within a 1 µm radius was correlated with difference in orientation preference relative to the soma across all 4 cells, the mean (r = 0.49 +/- 0.22 s.d.), suggesting that cell-to-cell variability has a minimal impact on our main conclusions.
Even with our limited measurements, there is a large amount of functional heterogeneity in dendritic spine responses (Extended Data Figure 2, Scholl et al. 2021), far greater than the small differences in somatic responses of these 4 cells (Figure 3, Scholl et al. 2021). Moreover, the individual dendrites from these 4 cells exhibited substantial heterogeneity in the distribution of mitochondria. We cannot rule out whether heterogeneity at various scales may obscure certain relationships or result in the weak correlations we observed. We also note that future advancements in volume electron microscopy should allow for greater sample sizes that can better address the role of functional (and structural) heterogeneity.We have added text in the Discussion section about the potential structure-function relationships that might be obscured or revealed by neuron heterogeneity.
1. The authors argued that "mitochondria are not necessarily positioned to support the energy needs of strong spines." However, the overall energy needs of a spine depend not only on the synaptic strength but also on the frequency of synaptic activity. Is there a correlation between the mitochondria volume around a spine and the overall activity of the spine? This data needs to be analyzed to confirm the distribution of mitochondria is independent of local energy needs.
The reviewer is correct, but our experimental paradigm was not optimally designed to measure the ‘frequency’ of synaptic activity in vivo. This could have been accomplished with flashed gratings or, perhaps, presenting drifting gratings at different temporal frequencies. For spines tuned to higher temporal frequencies in V1, we may expect greater energy needs, although as the reviewer suggests, energy needs will depend on synapse (and bouton) size. Because we are not able to directly measure activity frequency as carefully or beautifully as can be done ex vivo or in nerve fibers, we do not feel confident in attempting such analysis in this study. Instead, based on previous studies, we assumed that larger synapses might be able to transmit higher frequencies, and thus have higher energy demands. We believe future in vivo studies will more directly measure synaptic frequency for comparison with mitochondria.
We have added text in the Discussion about this caveat and potential future experiments.
1. In the results section, the authors briefly mentioned that "We also considered other spine response properties related to tuning preference; specifically, orientation selectivity and response amplitude at the preferred orientation. For either metric, we observed no relationship to mitochondria within 1 μm radius (selectivity: 1 μm: r = -0.081, p = 0.269, n = 60; max response amplitude: 1 μm: r = -0.179, p = 0.078, n = 64) but did see a weak, significant relationship to both at a 5 μm radius (selectivity: r = 0.175, p = 0.027, n = 121; max response amplitude: r = -0.166, p = 0.030, n = 129)." Here only statistic results were given while the data were not presented in the figure illustration. Based on the methods and Figure 3B, it seems that the preferred orientations were calculated based on the vector summation. How did the authors calculate the "response amplitude at the preferred orientation"? This needs to be clarified. In addition, given the huge variety of orientation selectivity, using the response amplitude at the preferred orientation may not be the best parameter to correlate with the mitochondria volume which is indicative of energy needs. It might be necessary to include the baseline activity without visual stimulation and the average response for visual stimuli of different orientations in the analysis.
We apologize for this oversight, as the details are present in our previous study (Scholl et al., 2021). Response amplitude and preferred orientation were calculated from a Gaussian curve fitting procedure with specific parameters describing those exact values (see Scholl et al. 2021 or Scholl et al. 2013). Only spines with selective responses (vector strength index > 0.1) and passing our SNR criterion were used for these analyses. We have now added this information to the Methods section and referred to it in the Results.With respect to the reviewer’s other concern, we also examined the average response amplitude (across all visual stimuli). There we found no relationship between the volume of mitochondria within 1 or 5 microns of a spine, however, because spines differ greatly in their selectivity (range = 0 – 0.8) the average response may not be an appropriate metric to compare across spines.
1. A continuation from the former point, do the spines with similar preferred orientation to the somatic Ca signal have similar Ca signal strength, orientation selectivity index and other characteristics to the spines with different preferred orientation? As shown in the examples (Figure 3B), the spine on the right with different orientation preference compared with its soma has considerably larger response in non-preferred orientation compared to the spine on the left. Thus, the overall activity of the spine on the right may be higher than the spine which has similar preferred orientation to the soma. The authors showed that a positive correlation between difference in orientation preference and mitochondria volume (Figure 3C). Could this be simply due to higher spine activity for non-preferred orientation or spontaneous activity? Thus, the mitochondria might be positioned to support spines with higher overall activity rather than diverse response property.
The reviewer brings up an interesting consideration. We examined the response properties of spines co-tuned (∆θpref < 22.5 deg) and differentially-tuned (∆θpref > 67.5 deg) to the soma. The orientation selectivity was not different between the two groups (p = 0.12, Wilcoxon ranksum test), although there was a small trend towards co-tuned inputs being more selective. We found that calcium response amplitudes for the preferred stimulus were also not different (p = 0.58, Wilcoxon ranksum test). These analyses are now included as a sentence in the Results.
We agree with the reviewer that higher spontaneous activity in non-preferred spines may help explain the mitochondrial relationship we observe. However, our current dataset does not have sufficiently long recordings to measure spontaneous synaptic activity. Further, when considering a non-anesthetized preparation, spontaneous activity is highly dependent on brain state and an animal’s self-driven brain activity, which all must be experimentally controlled or measured to accurately address this.
1. In addition, the information about the orientation selectivity of the soma is also missing. Do the four cells shown here all have similar level of orientation selectivity? Or some have relative weak orientation selectivity in the soma?
Yes, all 4 cells have a similar OSI (range = 0.4 – 0.57, mean = 0.46 +/ 0.08 s.d.). This has been added to the Results section.
1. This study focused on only a fraction of spines that are (1) responsive (2) osi > 0.1. However, in theory energy consumption is also related to non-responsive spines and spines with weak orientation tuning. What is the percentage of tuned and untuned spines? What's the correlation of mitochondria volume and spine activity level for untuned spines? I also recommend including the non-responsive spines into the analysis. For example, for each mitochondrion calculate the averaged overall activity of spines within certain distance from the mitochondrion, including the non-responsive spines. I would predict there may be more active spines and higher overall spine activity of dentritic segments near a mitochondrion than segments far from a mitochondrion.
A majority of spines were tuned for orientation (~91%), although we specifically chose to only analyze data from spines with verifiable, independent calcium events. All analyses except those involving measurements of orientation preference use all dendritic spines (i.e. tuned and untuned). We have clarified this in the Results.
These other ‘silent’ (i.e. without resolvable visual activity) spines may significantly contribute to energy demands of a dendrite too, as our methods (GCaMP6s expression) likely only capture synaptic events driving Ca+2 influx through NMDA receptors or VGCCs. We expect that glutamate imaging (e.g. iGlusnfr) may open the door to additional analyses to fully characterize functional relationship between spines and mitochondria.
1. The correlation coefficient for mitochondria volume and difference in orientation preference is relatively low (r=0.3150). With such weak correlation, the explanatory power of this data is limited.
We agree that while the correlation is significant, it is not particularly strong. To better represent the noise surrounding this measurement, we performed a bootstrap correlation analysis, sampling with replacement (1 micron: mean r = 0.31 +/- 0.11 s.e., 5 micron: mean r = 0.02 +/- 0.10 s.e.). We now include this in the Results.
1. Why do the numbers of spines in different figures vary? For example, n=60 for 1micron in Figure 3, 54 in Figure 3c, 31 in Figure 4b, 51 in Figure 4e and so on.
We apologize for the lack of clarity. Each analysis presented different requirements of the data. For example, orientation preference was computed only for selective (OSI > 1) spines (Fig. 3c), but this requirement did not apply to comparisons with selectivity or response amplitude (Fig. 3d). Similarly, as stated in the Results and Methods, measurements of local heterogeneity require a minimum number of neighboring spines (n > 2), limiting the number of usable spines for analysis (Fig. 4). We have clarified this in the text.
1. In Figure 6a, the sample sizes of mito+ spines and mito- spines are extremely unbalanced, which affects the stat power of the analysis. I recommend performing a randomization test.
We thank the reviewer for this suggestion. We ran permutation tests to compare the similarity in mean values between equally sampled values from each distribution. These tests supported our original analysis and conclusions. We have added these tests to the Results.
1. Ca signals are approximations of electrical signals. How well are spinal calcium signals correlated to synaptic strength and local depolarization? This should be put into discussion.
There is unlikely a simple, direct relationship between spine calcium signal and synaptic strength or membrane depolarization, and this has never been addressed in vivo. Koester and Johnston (2005) performed paired recordings in slice and showed that single presynaptic action potentials producing successful transmission generate widely different calcium amplitudes (Fig. 3). Another study from Sobczyk, Scheuss, and Svoboda (2005) used two-photon glutamate uncaging on single spines and showed that micro-EPSC’s evoked are uncorrelated with the spine calcium signal amplitude. We have added a note about this in the discussion.
1. In Figure 4i, the negative correlation may depend on the 4 data points on the right side. How influential are those data points?
Spearman’s correlation coefficient analysis is robust to outliers and it is highly unlikely these datapoints are critical with our sample size (n > 100 spines).
1. Raw data of Ca responses were missing.
Some data has been published with the parent publication (Scholl et al., 2021). As spine imaging data is difficult to obtain and highly unique, we prefer to provide raw data directly upon reasonable request of the corresponding author.
1. What is the temporal frequency of the drifting grating? Was it fixed or the speed of the grating was fixed?
This was fixed to 4 Hz and this is now included in the Methods.
Reviewer #2 (Recommendations For The Authors):
1. Most of the measurements were based on the distance from the base of the spine neck, and "only on spines with measurable mitochondrial volume at each radius" were analyzed. To better understand the causality, it may also be interesting to have an analysis based on the distance from mitochondria. Would the result be different if the measurements are not 1µm / 5µm from spine but 1µm / 5µm from mitochondria? (e.g. total spine volume in 1µm / 5µm from mitochondria).
In fact, our first iteration of this study focused on exactly this metric: measuring the distance to nearest mitochondria. However, after lengthy discussions between the authors, we ultimately decided this metric was inferior to a volumetric one. Our decision was based on several factors: (1) distance to mitochondrion is ill defined (e.g. distance to the a mitochondrion center or nearest membrane edge?), (2) the total amount of mitochondrial volume within a dendritic shaft should allow the greatest amount of energetic support (e.g. more cristae for ATP production, greater capacity for calcium buffering), and (3) we would not account for the geometry of individual mitochondria or their placement near a spine (e.g. when 2 different mitochondria are next to the same spine) We have added further clarification of our reasoning to the Results.
Nonetheless, we present the reviewer some of our original analyses correlating distance to mitochondria (from the base of the spine and including the spine neck length):
Author response image 1

Here, we examined the relationship to spine head volume, spine-soma orientation preference difference, and the local orientation preference heterogeneity.
No relationship showed any significant correlation. Again, this may not be surprising given the drawbacks of measuring ‘distance to mitochondria’.
1. Is there a selection criterion for the spine for the analysis? Are filopodia spines excluded in the analysis?
Spines were analyzed regardless of structural classification; however, they were only analyzed if they had a synaptic density with synaptic vesicle accumulation. In our dataset (including those visualized in vivo and reconstructed from the EM volume) we observed no filopodia.
1. The result states that "56.8% of spines had no mitochondria volume within 1 μm and 12.1% of spines had none within 5 μm.". In other words, around 43% of spines had mitochondria within 1 μm. It would be interesting to show whether there is a correlation between mitochondria size and spine density.
We agree that this is an interesting measurement. It has been reported that mitochondrial unit length along the dendrite co-varies with linear synapse density in the neocortical distal dendrites of mice (Turner et al., 2022). This was specifically true in distal portions of dendrites more than 60 µm from the soma, because mitochondria volume increases as a function of distance roughly up to this point, then remains relatively constant beyond this distance.
To investigate this possibility, we calculated the local spine density around an individual spine and compared to the mitochondria volume within 1 or 5 µm. We found no evidence of a correlation between local spine density and the volume of mitochondria (1 µm: Spearman r = -0.07447, p = 0.2859; 5 µm: r = -0.04447, p = 0.3141). However, the majority of our measurements are more proximal than 60 µm (our median distance of all spines = 49.4 µm, max = 114 µm) and this may be one reason why observe no correlation.
1. In Figure 3B, the drifting grating directions are examined from 0 to 315 degrees in the experiment. However, in Figure 3C and 3D, the spine-soma difference of orientation preference was limited to 0 to 90 degree in the graph. Is the graph trimmed, or is there a cause that limits the spine-soma difference of orientation preference to 90?
Ferret visual cortical neurons are highly sensitive to grating direction and the responses are fit by a double Gaussian curve which estimates the ‘orientation preference’ (0-180 deg). We then calculated the absolute difference in orientation preference and wrapped that value in circular space so the maximum difference possible is 90 deg (e.g. 135 deg -> 45 deg).
1. In Figure 4D-F, how is the temporal correlation of calcium activity determined? Is it based on stimulated activity or basal activity? A brief explanation may be helpful to the readers. Also, scale bars could be added to Fig 4D.
Temporal correlation is computed as the signal correlation between 2 spines over the entire imaging session at that field of view. Specifically, we measured the Pearson correlation between each spine’s ∆F/F trace. To measure the local spatiotemporal correlation, we computed correlations between all neighboring spines within 5 microns and took the average of those values. We have clarified this in the Results section.
1. Figure 3C and Figure 4D displayed a significant correlation in 1µm range and such correlation drastically diminished once the criterion changed to 5µm range. It would be interesting to include the criterion of intermediate ranges. It would be interesting to see if there is a trend or tendency or if there is a "cut-off" limit.
We agree with the reviewer that the drastic change in the correlations between 1 and 5 µm range was surprising to see. While these volumetric measurements are time consuming, we returned to our data and measured an intermediate point of 3 µm. Investigating relationships reported in our study, we found no significant trends for spine-soma similarity (Spearman’s r = -0.011, p = 0.54) or local heterogeneity (Spearman’s r = 0.11, p = 0.23). This suggests that a potential ‘critical distance’ might be less than 3 µm; however, far more additional measurements and analyses would be needed to attempt to identify exactly what this distance is.
1. In Figure 5, it is shown that spines having mitochondrion in the head or neck are larger. However, only 10 spines are found with mitochondria inside. In the current dataset, are mitochondria abundantly found in large spines? Further analysis or justification would be informative to address this.
In our dataset, mitochondria were found in ~5% of all spines. Spines with mitochondria have a median volume of approximately 0.6 µm3, roughly twice as large as than those without mitochondria, as the reviewer suggests. In the entire population of spines without mitochondria, a volume of 0.6 µm3 represents roughly the 82nd percentile. In other words, of the total population of 157 spines without mitochondria, only 29 had equal or greater volume than the median spine with a mitochondrion. We believe this trend is clearly shown in Figure 5A and is supported by our analysis, including new permutation tests suggested by Reviewer 1.
Reviewer #3 (Recommendations For The Authors):
1. The authors state that their unsupervised method "quickly and accurately identified mitochondria," but the methods section only says that segmentations were proofread. Was every segmentation examined and judged to be accurate, or was only a subset of the 324 mitochondria checked?
After deep learning-based extraction, each mitochondrion segmentation was manually proofread. For each dendrite segment, this was ~10-20 mitochondria, so it did not take long to manually inspect and edit each mitochondrion segmentation.
1. The EM image of the mitochondrion in the spine head in Figure 2C is low resolution and does not apply to the bulk of the data. Images more representative of the analyzed data should be added to supplement the cartoons.
Our primary rationale for including this specific image was to show that the mitochondria located within spines are small, round, and to include a view of the synapse as well as the mitochondrion. We now include enlarge and additional EM images to Figure 1C.
1. The majority of spines did not have any mitochondria within a 1 micron radius and were excluded from the correlation analyses, so most of the conclusions are based on a minority of spines. It would be interesting to see comparisons between spines with and without nearby mitochondria. Correlations between the absolute distance to any mitochondrion, synapse size, and mismatch to soma orientation would be especially interesting.
The reviewer brings up a good point. It is true that many spines were excluded from our analysis based on the fact that they did not have nearby mitochondria within 1 or 5 µm (56.8% of spines had no mitochondria volume within 1 μm and 12.1% of spines had none within 5 μm). We compared the distributions of synapse size, mismatch to soma, and orientation selectivity of two groups of spines – those with at least some mitochondria within 1 µm (n = 65) versus spines without any mitochondria within 5 µm (n = 19).
We found no difference in the distributions between spine volume (1 µm: median = 0.29 µm3, IQR = 0.41 µm3; no mitochondria within 5 µm: median = 0.40 µm3, IQR = 0.37 µm3; p = 0.67) or PSD area (1 µm: median = 0.26 µm2, IQR = 0.33 µm2; no mitochondria within 5 µm: median = 0.31 µm2, IQR = 0.36 µm2; p = 0.49). For functional measures, we also saw no difference in orientation selectivity (1 µm: median = 0.29, IQR = 0.28; no mitochondria within 5 µm: median = 0.28, IQR = 0.15; p = 0.74) or mismatch to soma orientation (1 µm: median = 0.54 deg, IQR = 0.86 deg; no mitochondria within 5 µm: median = 0.46 deg, IQR = 0.47 deg; p = 0.75). We now include analyses in the Results.
We also looked at the absolute distances to mitochondria and did not find any significant relationships to spine head volume, spine-soma orientation preference difference, or the local orientation preference heterogeneity (see our response to reviewer #2 for more information).
1. In Figure 1A the mitochondria appear to be taking up a substantial fraction of the dendritic shaft diameter, even for distal dendrites. It would be useful to know the absolute diameter of the dendrites and mitochondria, given that this is not rodent data and there is no reference for either in the ferret.
We agree with the reviewer’s point, although we would like to remind the reviewer that these are basal dendrites of layer 2/3 cells. Basal dendrites tend to be thinner than apical branches. Interestingly, in some cases, the dendrite even swells to accommodate a mitochondrion. We did not incorporate this measurement in our study because it is not trivial; dendrite diameter is variable and dendrites are not perfect cylinders. Although we did not make precise measurements across our dendrites, the diameter is comparable to what has been seen in mouse cortex (Turner et al., 2022), roughly 500-1000 nm, but as small as 100 nm at some pinch points. In terms of mitochondria, many were roughly spherical or oblong, therefore the maximum diameters we report are roughly similar to, if not a bit larger than, those of the cross-sectional diameter.
1. As a rule, PSD area is correlated with spine volume, which makes the observation that spines with mitochondria have larger volume but not PSD area surprising. With n=10 it is difficult to draw conclusions, but it would be interesting to know the PSD area-to-volume ratio of other spines of the same volume and synapse size.
We were also somewhat surprised to see this, but exactly as the reviewer mentioned, we believe it to be a limitation of the sample size. The difference in volume was large enough to be detected despite a small sample size. We saw a trend towards larger synapses when spines have mitochondria (the median was approximately 60% larger), and we would expect with a larger comparison that PSD area would be significantly greater in spines with mitochondria.
We calculated the PSD area-to-spine head volume ratio for spines with or without mitochondria. Spines with mitochondria had a significantly lower ratio compared to those without (Mann-Whitney test, p = 0.0056, mito - = 0.78, n = 10; mito + = 0.53, n = 157). As the reviewer mentions, it is somewhat difficult to draw a conclusion from this, but it appears that the PSD does not scale with the increased spine head size.
Author response image 2
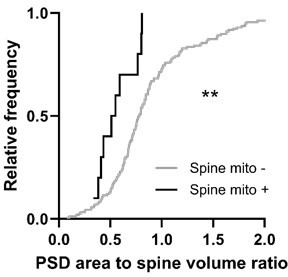
The only way to definitively address this is to increase the sample size, which is becoming easier to achieve with the progression of volume EM imaging and analysis techniques in recent times. We look forward to addressing this in the future.
1. Nothing is made of the significant fact that these data come from the visual system of a carnivore, not a mouse. Consideration of differences in visual physiology between rodents and carnivores would be worthwhile to put the function of these dendrites in context.
We thank the reviewer for this consideration and have added text to the Discussion.
https://doi.org/10.7554/eLife.89682.3.sa4Article and author information
Author details
Funding
Max Planck Florida Institute for Neuroscience
- Connon I Thomas
- Melissa A Ryan
- Naomi Kamasawa
National Eye Institute (EY031137)
- Benjamin Scholl
The funders had no role in study design, data collection and interpretation, or the decision to submit the work for publication.
Acknowledgements
The authors thank Nicole Shultz and Rachel Satterfield for help with perfusions and fixative preparation, Tal Laviv for comments, the Fitzpatrick lab for useful discussions, and the MPFI ARC for animal care. The authors thank the GENIE project for access to GCaMP6.
Ethics
All procedures were performed according to NIH guidelines and approved by the Institutional Animal Care and Use Committee at Max Planck Florida Institute for Neuroscience (Protocol #23-002).
Senior Editor
- John R Huguenard, Stanford University School of Medicine, United States
Reviewing Editor
- Jun Ding, Stanford University, United States
Version history
- Sent for peer review: July 5, 2023
- Preprint posted: July 14, 2023 (view preprint)
- Preprint posted: September 1, 2023 (view preprint)
- Preprint posted: November 17, 2023 (view preprint)
- Version of Record published: December 7, 2023 (version 1)
Cite all versions
You can cite all versions using the DOI https://doi.org/10.7554/eLife.89682. This DOI represents all versions, and will always resolve to the latest one.
Copyright
© 2023, Thomas et al.
This article is distributed under the terms of the Creative Commons Attribution License, which permits unrestricted use and redistribution provided that the original author and source are credited.
Metrics
-
- 25
- Page views
-
- 10
- Downloads
-
- 0
- Citations
Article citation count generated by polling the highest count across the following sources: Crossref, PubMed Central, Scopus.
Download links
A two-part list of links to download the article, or parts of the article, in various formats.
Downloads (link to download the article as PDF)
Open citations (links to open the citations from this article in various online reference manager services)
Cite this article (links to download the citations from this article in formats compatible with various reference manager tools)
Postsynaptic mitochondria are positioned to support functional diversity of dendritic spines
eLife 12:RP89682.
https://doi.org/10.7554/eLife.89682.3
Further reading
-
- Neuroscience
Several discrete groups of feeding-regulated neurons in the nucleus of the solitary tract (nucleus tractus solitarius; NTS) suppress food intake, including avoidance-promoting neurons that express Cck (NTSCck cells) and distinct Lepr- and Calcr-expressing neurons (NTSLepr and NTSCalcr cells, respectively) that suppress food intake without promoting avoidance. To test potential synergies among these cell groups we manipulated multiple NTS cell populations simultaneously. We found that activating multiple sets of NTS neurons (e.g., NTSLepr plus NTSCalcr (NTSLC), or NTSLC plus NTSCck (NTSLCK)) suppressed feeding more robustly than activating single populations. While activating groups of cells that include NTSCck neurons promoted conditioned taste avoidance (CTA), NTSLC activation produced no CTA despite abrogating feeding. Thus, the ability to promote CTA formation represents a dominant effect but activating multiple non-aversive populations augments the suppression of food intake without provoking avoidance. Furthermore, silencing multiple NTS neuron groups augmented food intake and body weight to a greater extent than silencing single populations, consistent with the notion that each of these NTS neuron populations plays crucial and cumulative roles in the control of energy balance. We found that silencing NTSLCK neurons failed to blunt the weight-loss response to vertical sleeve gastrectomy (VSG) and that feeding activated many non-NTSLCK neurons, however, suggesting that as-yet undefined NTS cell types must make additional contributions to the restraint of feeding.
-
- Genetics and Genomics
- Neuroscience
In the fruit fly Drosophila melanogaster, gustatory sensory neurons express taste receptors that are tuned to distinct groups of chemicals, thereby activating neural ensembles that elicit either feeding or avoidance behavior. Members of a family of ligand -gated receptor channels, the Gustatory receptors (Grs), play a central role in these behaviors. In general, closely related, evolutionarily conserved Gr proteins are co-expressed in the same type of taste neurons, tuned to chemically related compounds, and therefore triggering the same behavioral response. Here, we report that members of the Gr28 subfamily are expressed in largely non-overlapping sets of taste neurons in Drosophila larvae, detect chemicals of different valence, and trigger opposing feeding behaviors. We determined the intrinsic properties of Gr28 neurons by expressing the mammalian Vanilloid Receptor 1 (VR1), which is activated by capsaicin, a chemical to which wild-type Drosophila larvae do not respond. When VR1 is expressed in Gr28a neurons, larvae become attracted to capsaicin, consistent with reports showing that Gr28a itself encodes a receptor for nutritious RNA. In contrast, expression of VR1 in two pairs of Gr28b.c neurons triggers avoidance to capsaicin. Moreover, neuronal inactivation experiments show that the Gr28b.c neurons are necessary for avoidance of several bitter compounds. Lastly, behavioral experiments of Gr28 deficient larvae and live Ca2+ imaging studies of Gr28b.c neurons revealed that denatonium benzoate, a synthetic bitter compound that shares structural similarities with natural bitter chemicals, is a ligand for a receptor complex containing a Gr28b.c or Gr28b.a subunit. Thus, the Gr28 proteins, which have been evolutionarily conserved over 260 million years in insects, represent the first taste receptor subfamily in which specific members mediate behavior with opposite valence.


