Sustained store-operated calcium entry utilizing activated chromatin state leads to instability in iTregs
- Institute for Immunology, Beijing Key Lab for Immunological Research on Chronic Diseases, Tsinghua University, China
- Tsinghua-Peking Center for Life Sciences, Tsinghua University, China
- IDG/McGovern Institute for Brain Research and School of Pharmaceutical Sciences, Tsinghua University, China
- MOE Key Laboratory of Bioinformatics, Center for Synthetic and Systems Biology, School of Pharmaceutical Sciences, Tsinghua University, China
- Department of Basic Medical Sciences, School of Medicine, Tsinghua University, China
- Department of Microbiology, Immunology and Infectious Diseases, Snyder Institute, University of Calgary, Canada
- Key Laboratory of Pathogenic Microbiology and Immunology, Institute of Microbiology, Chinese Academy of Sciences, China
- University of Chinese Academy of Sciences, China
Abstract
Thymus-originated tTregs and in vitro induced iTregs are subsets of regulatory T cells. While they share the capacity of immune suppression, their stabilities are different, with iTregs losing their phenotype upon stimulation or under inflammatory milieu. Epigenetic differences, particularly methylation state of Foxp3 CNS2 region, provide an explanation for this shift. Whether additional regulations, including cellular signaling, could directly lead phenotypical instability requires further analysis. Here, we show that upon TCR (T cell receptor) triggering, SOCE (store-operated calcium entry) and NFAT (nuclear factor of activated T cells) nuclear translocation are blunted in tTregs, yet fully operational in iTregs, similar to Tconvs. On the other hand, tTregs show minimal changes in their chromatin accessibility upon activation, in contrast to iTregs that demonstrate an activated chromatin state with highly accessible T cell activation and inflammation related genes. Assisted by several cofactors, NFAT driven by strong SOCE signaling in iTregs preferentially binds to primed-opened T helper (TH) genes, resulting in their activation normally observed only in Tconv activation, ultimately leads to instability. Conversely, suppression of SOCE in iTregs can partially rescue their phenotype. Thus, our study adds two new layers, cellular signaling and chromatin accessibility, of understanding in Treg stability, and may provide a path for better clinical applications of Treg cell therapy.
eLife assessment
This study presents the valuable finding that sustained calcium signaling in induced-Treg (iTreg) cells can lead to the loss of Foxp3 expression and iTreg identity by altering the chromatin landscape. The evidence supporting the claims of the authors is convincing. The work will be of interest to immunologists working on Treg cell therapy.
https://doi.org/10.7554/eLife.88874.3.sa0Introduction
The regulatory T cells (Tregs) are key to maintain peripheral immune tolerance and to block excessive inflammatory reactions. There are two main populations of Tregs. The prototypical one originates from the thymus (tTreg), sharing a developmental program similar to conventional T cells (Rudensky, 2011; Sakaguchi et al., 2008). Their TCRs are believed to have higher basal affinity to MHC (major histocompatibility antigen), and express Foxp3 during CD4 single positive period (Fontenot et al., 2005). The other population originates from the periphery (pTregs) via conversion of Tconvs, arising during inflammation with proper antigenic stimulation and inductive cytokine environment (Curotto de Lafaille et al., 2004; Apostolou and von Boehmer, 2004; Cobbold et al., 2004). iTregs, mimicking the induction of pTregs, is a type of Tregs induced in vitro in the presence of TGF-β (tumor growth factor ) (Chen et al., 2003; Fantini et al., 2004). While iTregs share similarity in suppressive capacities to Tregs in vivo (Shevach and Thornton, 2014; Fu et al., 2004; Singh et al., 2009), they are different from tTregs in several aspects, particularly regarding their stabilities. Although tTregs in some occasions show certain levels of plasticity, their phenotypes are mostly stable, both in vivo and in vitro (Rubtsov et al., 2010). iTregs induced in vitro are more labile with marked loss of Foxp3 expression after activation, limiting the duration of their suppression (Floess et al., 2007; Chen et al., 2011). The short life of iTregs is also a roadblocker of the clinical use of Treg cell therapy, as they cannot be used as an alternative source to replace numerically limited tTregs (Koenecke et al., 2009); and in cases where iTregs are raised with targeted specificities, they carry concerns of potential self-reactivity following the loss of Foxp3.
The stability of tTregs is established prior to their exit from the thymus (Ohkura et al., 2013). In the thymus, Foxp3 works with other transcription factors, such as NFAT and c-Rel to maintain a steady transcriptional program (Fu et al., 2012; Hill et al., 2007; Samstein et al., 2012). At the same time, the extensive demethylation of Foxp3 CNS2 is also critical to their stable phenotype, an event likely taking place before Foxp3 expression (Samstein et al., 2012; Ohkura et al., 2012). While epigenetic differences provide a possible explanation of Treg stability, it is more probable that multiple factors collectively contribute to the difference. Unlike Tconvs that undergo expansion, attrition, and memory states after activation, tTregs lose signature changes and return to their original state following activation (van der Veeken et al., 2016). This persistence in phenotype of tTregs is certainly beneficial to the host, yet mechanisms for this maintenance, in contrast to the lack thereof in iTregs are incompletely understood. Previous work suggests that TCR signal as well as ensuing Ca2+ activities are weaker in tTregs (Sumpter et al., 2008; Vaeth et al., 2012; Yan et al., 2015), whether the reduced TCR signaling strength is the root of tTreg stability remains an intrigue, particularly strong TCR engagement facilitates iTregs’ loss of phenotype.
Here, we report a surprising finding that may contribute to the iTregs’ phenotypical change after their activation. We found that ligation of TCR induces long vibration of Ca2+ signals in Tconvs that lasts for hours, as typically expected in the store-operated calcium entry (SOCE) activation. Initially similar, this vibration is quickly diminished in tTregs, correlating with their reduced response to TCR stimulation. In contrast, in iTregs, this Ca2+ vibration is indistinguishable from Tconvs. The sustained Ca2+ signal leads to a strong NFAT activation in iTregs. Regarding chromatin accessibility, with the aid of our initial observation of iTregs from the perspective of activated Tconv, we found iTregs also show an ‘activated’ chromatin state with T cell activation and inflammation related genes highly open. We demonstrate that the NFAT nuclear translocation driven by sustained calcium signal allows its direct access to prime-opened TH genes and upregulate their expression, destabilizing iTregs. As expected, blocking CRAC channel reverses the loss of Foxp3 in iTregs in vitro and in vivo. Our work therefore suggests that Ca2+ signaling and accessible chromatin state in iTregs are two key causes in their loss of stability following activation, which may be of important value to understand how these two populations of Tregs operate in the disease conditions and lead to better applications of iTregs in the clinic.
Results
iTregs use a suppression mechanism similar to that of tTregs
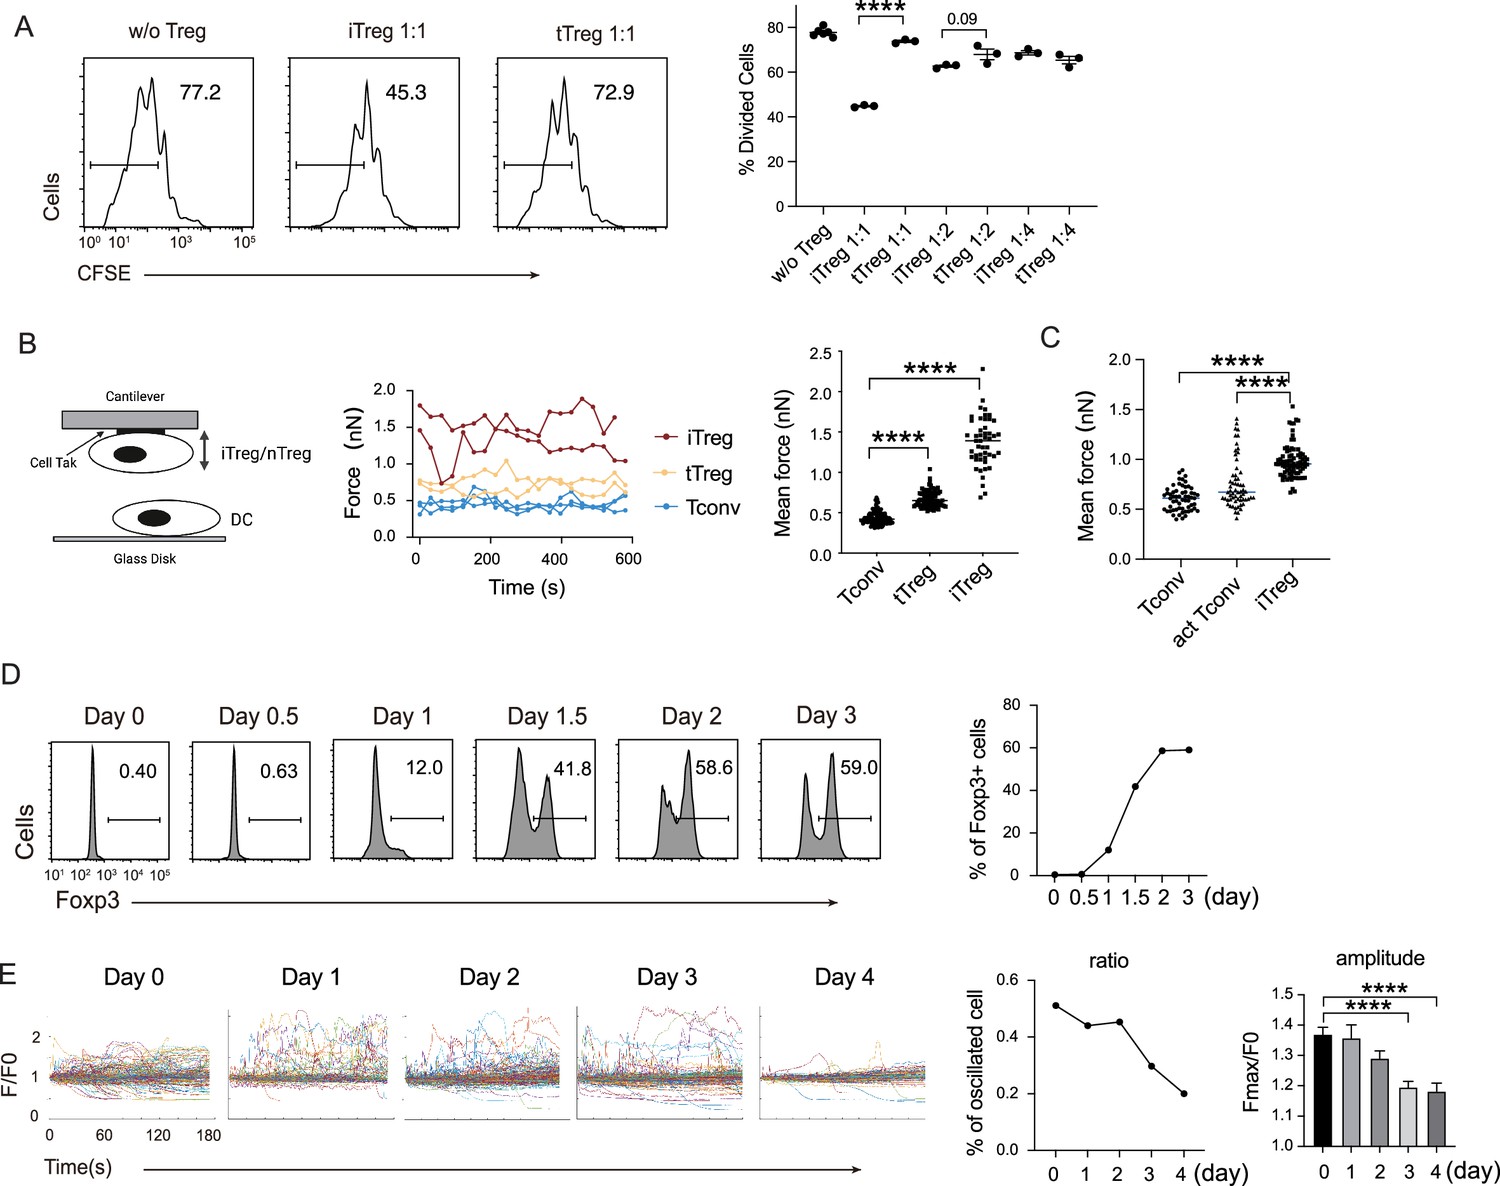
In our previous work, we found that Tregs show strong binding to DCs, which is a key mechanism for blocking DC’s ability to engage other Tconvs (Chen et al., 2017). The strong binding is due to low basal calcium oscillation of tTregs in the steady state (Wang et al., 2022), which leads to diminished mCalpain activation and commensurate reduced internalization of LFA-1. Furthermore, our previous study showed the low calcium oscillation is maintained by reduced expression of endosomal Ca2+ channel Ryr2 by Foxp3 (Wang et al., 2022). To ascertain that this regulation is also central to iTregs, we produced iTregs from Tconvs. With plate-bound anti-CD3/CD28 and in the presence of TGF-β, iTregs were induced and the percentage was maximized on day 2. We found that in vitro iTregs show stronger suppression than tTregs on OT-II proliferation in response to epitope peptide loaded DCs (Figure 1A). In accordance with the stronger suppression, single-cell force spectroscopy analysis showed that iTregs possessed apparent binding to DCs, even stronger than tTregs (Figure 1B). In addition, iTregs also showed increased binding force compared with activated Tconvs (Figure 1C), suggesting the strong binding force is a common feature of both types of Tregs, but not Tconvs. We measured the expression of Foxp3 more precisely, and noticed that the protein-level expression of Foxp3 reached its peak on day 2 after the induction (Figure 1D). With the accumulation of Foxp3 protein, basal Ca2+ oscillation in the treated Tconvs was gradually diminished, with the former leading the latter roughly by 1 day (Figure 1E). As expected, the transcription level of Ryr2 was suppressed both in iTregs and tTregs (Figure 1—figure supplement 1A), suggesting that the strong binding force with DC may come from reduced calcium oscillation as a result of Foxp3-mediated suppression of Ryr2 transcription. While Ryr2 expression may be regulated by Foxp3, the induction efficiency of Foxp3 was not affected by Ryr2 knock out (Figure 1—figure supplement 1B). Therefore, we show iTregs can apply a suppression mechanism similar to tTregs, which operates via the indirect inhibition via DC blockage. We do not know why iTregs show a stronger suppression than tTregs, an event maybe related to their activation in the induction process.
Figure 1 with 1 supplement see all
iTreg share similar suppressive mechanism to tTregs.
(A) Comparison of suppressive activity between tTreg and iTreg. CFSE (carboxy fluoroscein succinimidyl Eester) -labeled OT-II T cells were stimulated with OVA-pulsed DC, then Foxp3-GFP+ iTregs and tTregs were added to the culture to suppress the OT-II proliferation. After 4 days, CFSE dilution were analyzed. n = 3, N = 3. Left, representative histograms of CFSE in divided Tconvs. Right, graph for the percentage of divided Tconvs. (B) iTregs possessed stronger binding force to DCs than tTreg. A schematic diagram for AFM-SCFS (atomic force microscope-single cell force spectroscopy) assay setup (left). SCFS force readings for Tconv, tTreg, and iTreg adhering to DC2.4 cells, one line represents a pair of T–DC, every dot represents force reading from each contact. Mean force of Tconv, tTreg, and iTregs adhering to DC2.4 cells. (C) iTregs showed increased binding force compared with activated Tconvs. Mean force of Tconv, activated Tconv, and iTreg adhering to DC2.4 cells. n > 45, N = 3. (D) Precise expression of Foxp3 was assessed during iTreg induction. Naive Tconvs were stimulated with anti-CD3 and anti-CD28, in the presence of TGF-β and IL-2 to induce iTregs. Cells were harvested at the indicated time and Foxp3 expression was analyzed by intracellular staining. (E) Basal Ca2+ oscillation was assessed during iTreg induction. Naive Tconvs were stimulated with anti-CD3 and anti-CD28, in the presence of TGF-β and IL-2 to induce iTregs. Cells were harvested at the indicated time and loaded with Fluo-4 AM, and Fluo-4 fluorescence over time were recorded with confocal microscope. The change of intracellular free Ca2+ concentration over time were shown as F/F0. The ratio of oscillated cells and standard deviation of F/F0 were calculated. n > 150, N = 3. Here, ****p < 0.0001, by Student’s t-est.
-
Figure 1—source data 1
The suppression activity, AFM force of iTreg and nTreg, and calcium oscillation during iTreg induction.
- https://cdn.elifesciences.org/articles/88874/elife-88874-fig1-data1-v1.xlsx
Sustainment of SOCE and NFAT nuclear translocation are reduced in tTregs, but not in iTregs
It was reported previously that TCR signaling led to a dramatic reduction of Foxp3+ cells in iTregs, but not in tTregs (Chen et al., 2011; Selvaraj and Geiger, 2007). We reproduced these data in our laboratory (Figure 2A). tTregs have been reported to show an attenuated response to TCR triggering (Sumpter et al., 2008; Vaeth et al., 2012; Yan et al., 2015), the exact point of signal attenuation in tTregs has not been elucidated. In immune cells, there are mainly three types of Ca2+ signals, the steady-state low-level Ryr2-based membrane proximal Ca2+ ‘puff’; the TCR ligation-triggered, inositol triphosphate-mediated IP3R opening on the ER (endoplasmic reticulum) endothelia membrane; and ER Ca2+ depletion-induced, sustained Ca2+ influx upon SOCE activation (Guse, 1998). As the extracellular Ca2+ is roughly 4 logs higher than the intracellular, SOCE activation is by far the strongest Ca2+ event in T cells (Figure 2—figure supplement 1A), and is also distinct from the other Ca2+ signaling patterns for its persistent vibration lasting hours to days (Christo et al., 2015; Wülfing et al., 1997).
Figure 2 with 1 supplement see all
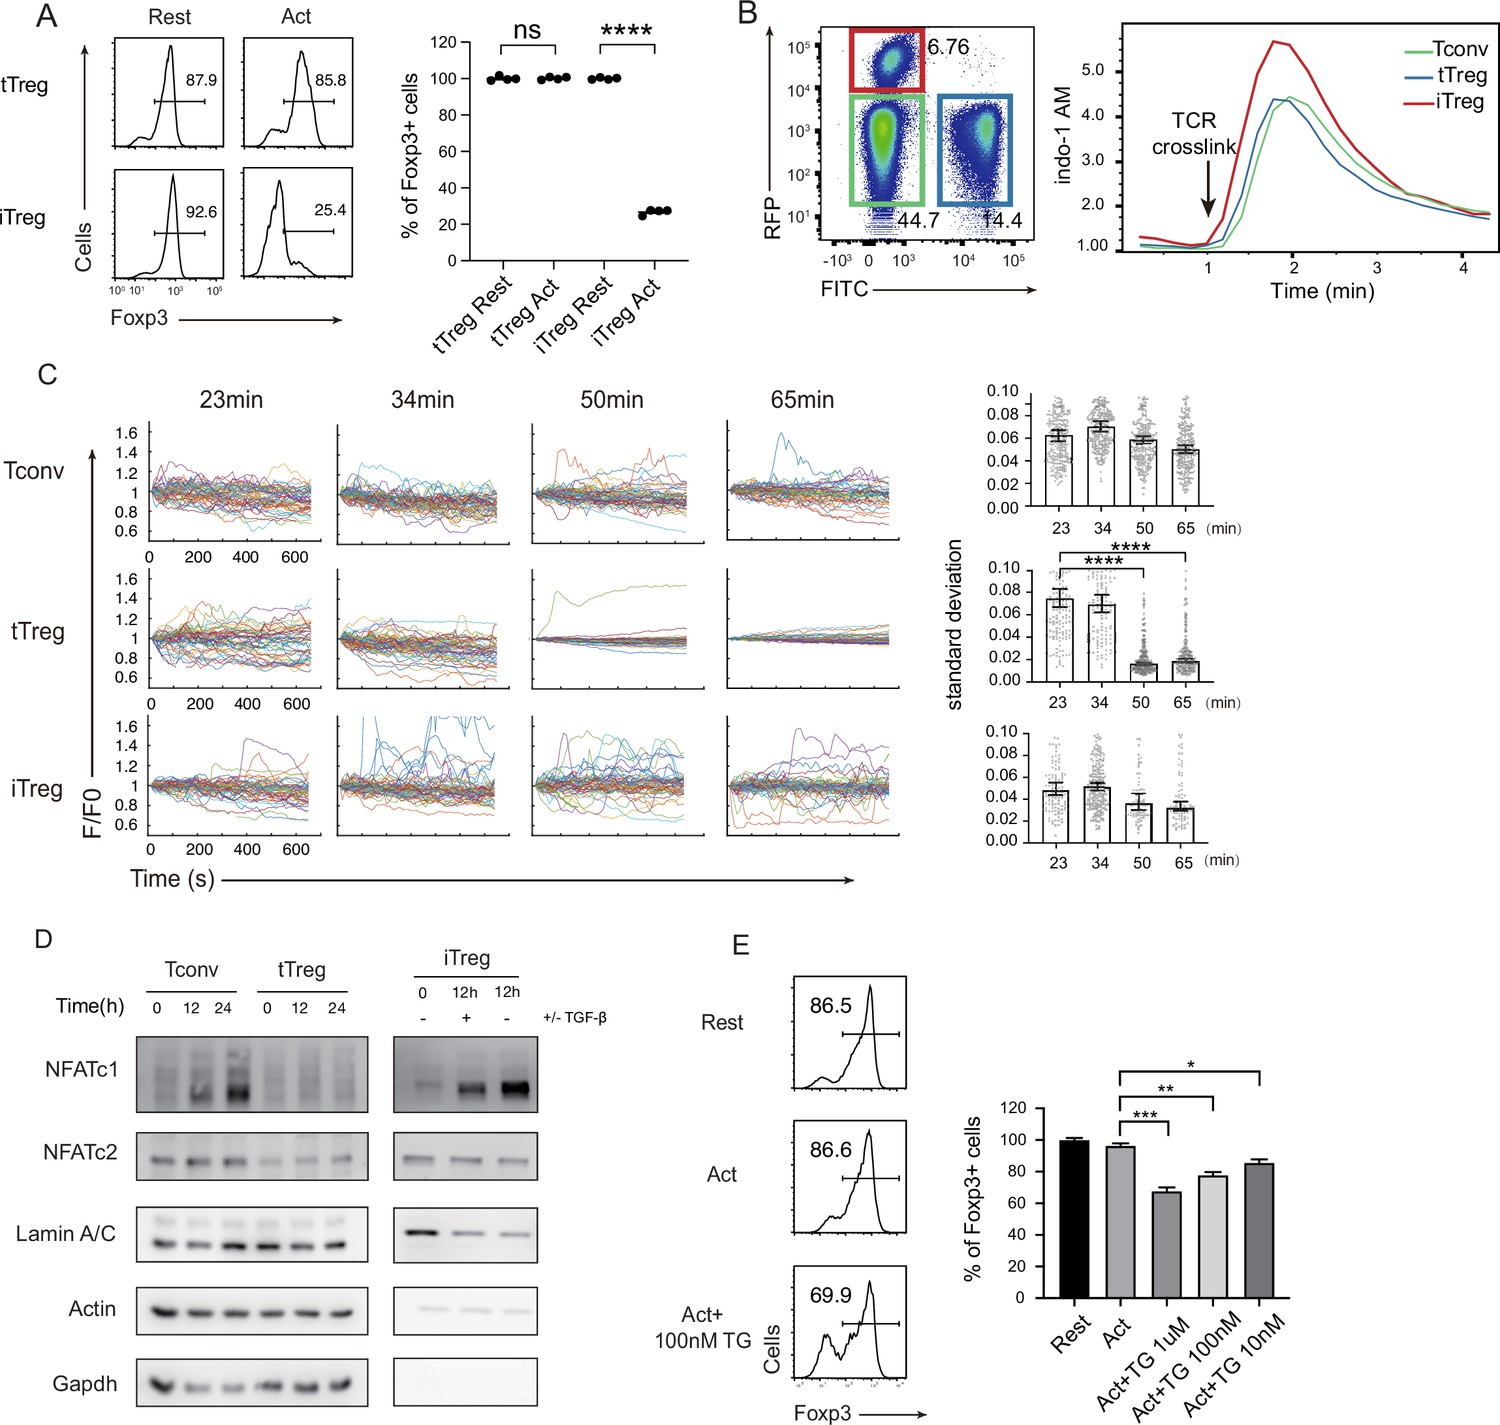
Diminished store-operated calcium entry (SOCE) signal and NFAT translocation in tTregs, but not in iTregs.
(A) Comparison of Treg stability between tTregs and iTregs. iTregs and tTregs were sorted and restimulated with anti-CD3 and anti-CD28 antibodies. Cells were harvested after 2-day restimulation and Foxp3 expression was analyzed by intracellular staining. The percentages of Foxp3+ cells were monitored by FACS (fluorescence-activated cell sorting). Left, representative histograms of restimulated iTregs. Right, graph for the percentage of Foxp3+ cells in all CD4+ cells. n = 4, N = 5. (B) Early SOCE signal was measured in iTreg, tTreg, and Tconv by flow cytometry. Sorted Foxp3-RFP+ iTreg and Foxp3-GFP+ tTreg and double negative Tconv cells were mixed and loaded with Indo-1 AM, then stained with biotin anti-CD3 and biotin anti-CD28 for 1 hr, the baseline fluorescence was recorded for 1 min, and then TCR crosslink was perform by the addition of streptavidin. Left, the gate of three mixed cells. Right, Indo-1 AM ratio of these cells upon TCR crosslink. N = 3. (C) Long-term SOCE were truncated in tTreg, but sustained in iTreg. Tconv, tTreg, and iTreg cells were loaded with Fluo-4 AM and activated by anti-CD3 and anti-CD28 in confocal dish. Fluorescence was recorded in the indicated time after stimulation with the interval of 10 s. Left, the F/F0 of mean fluorescence intensities were calculated and presented. Right, graph for standard deviation of fluorescence in these cells. n > 50, N = 3. (D) NFAT accumulate much in nucleus of iTreg, but not in tTreg. Tconv, tTreg, and iTreg cells were stimulated by anti-CD3 and anti-CD28, after the indicated times, cells were lysed and the cytoplasmic/nuclear components were separated. The cytoplasmic and nuclear NFATc1 and NFATc2 were analyzed by western blot. Actin and GAPDH were used as loading control of cytoplasmic proteins, and LaminA/C as nuclear. N = 4. (E) Forcibly sustained calcium signal destabilizes tTreg. Foxp3-RFP+ tTregs were stimulated by anti-CD3 and anti-CD28. After 1 hr, various concentrations TG were added in the culture medium. Cells were collected after 24-hr stimulation and Foxp3 expression was analyzed by intracellular staining. Left, representative histograms of treated tTregs. Right, graph for the percentage of Foxp3+ cells in all tTregs. n = 3, N = 3. Here, *p < 0.05; **p < 0.01; ***p < 0.001; ****p < 0.0001, by Student’s t-test.
-
Figure 2—source data 1
Treg stability, early store-operated calcium entry (SOCE) signal, long-term SOCE signal in iTreg and nTreg.
- https://cdn.elifesciences.org/articles/88874/elife-88874-fig2-data1-v1.xlsx
-
Figure 2—source data 2
Original imaging data of long-term store-operated calcium entry (SOCE) signal in Tconv, nTreg, and iTreg, related to Figure 2C.
- https://cdn.elifesciences.org/articles/88874/elife-88874-fig2-data2-v1.zip
-
Figure 2—source data 3
Original western data of NFAT nuclear translocation in Tconv, nTreg, and iTreg, related to Figure 2D.
- https://cdn.elifesciences.org/articles/88874/elife-88874-fig2-data3-v1.zip
We wondered if the reported TCR signal truncation in tTregs was manifested as reduced SOCE activities. We titrated anti CD3/CD28 concentrations, and iTregs lost Foxp3 at the lowest dose required to activate, yet tTregs were resistant to an eightfold increase in both (Figure 2—figure supplement 1B). To study the molecular basis for the weak response in tTregs, we first monitored the early SOCE intensity in iTregs and tTregs, we found the first wave of SOCE in iTregs was slightly higher than Tconvs and tTregs, but there was no discernable difference between tTregs and Tconvs (Figure 2B). In addition, the phosphorylation of CD3ζ was similar in Tconv and nTreg immediately after TCR crosslink (Figure 2—figure supplement 1C). As full T cell activation requires sustained SOCE activation (Dolmetsch et al., 1998), we extended the observation time window. As SOCE signal is synchronized upon initial TCR trigger, each individual T cell SOCE oscillation hours into activation is no longer in unison (Christo et al., 2015; Le Borgne et al., 2016), we therefore recorded Ca2+ waves in individual cells. In Tconvs and iTregs, Ca2+ remained cyclic waves expected in SOCE pulsation. In contrast, this Ca2+ signal was suddenly lost in tTregs 40–50 min after the activation (Figure 2C; Videos 1–3).
Video 1
Imaging of store-operated calcium entry (SOCE) signal in Tconvs.
Video 2
Imaging of store-operated calcium entry (SOCE) signal in tTregs.
Video 3
Imaging of store-operated calcium entry (SOCE) signal in iTregs.
In contrast to other transcriptional factors, such as NF-κB, activated rapidly in response to short Ca2+ elevation, NFATs are known to be triggered only by sustained cytoplasmic Ca2+ (Dolmetsch et al., 1998; Dolmetsch et al., 1997; Tomida et al., 2003). Indeed, in contrast to iTregs and Tconvs, tTregs’ NFATc1 and c2 failed to translocate into the nucleus (Figure 2D). Upon detailed analysis, in iTregs, anti-CD3/CD28 stimulation led a quick drop in cytoplasmic NFAT in 2 hr, with moderate accumulation of NFAT in the nucleus (Figure 2—figure supplement 1D). This was followed by continuous synthesis of NFAT in the cytoplasm and accumulation of nuclear NFAT (Serfling et al., 2006; Zhou et al., 2002). While tTregs are known to have reduced NFAT activation in response to TCR ligation (Sumpter et al., 2008; Nayak et al., 2009), our results pointed to a truncated Ca2+ response likely to be the molecular basis for this phenotype. With this association potentially established, we wondered if the length of SOCE itself is sufficient to explain the stability difference between iTregs and tTregs. Non-specific Ca2+ membrane permeability modifier such as ionomycin resulted in large-scale cell death (Figure 2—figure supplement 1E), we therefore used SERCA inhibitor Thapsigargin (TG). Blocking SERCA leads to endosome Ca2+ reloading blockage that leads to continuous translocation of STIMs to the plasma membrane–ER junction and Orai channel opening. In contrast to indiscriminating Ca2+ overload, pure SOCE activation was not followed by significant cell death (Figure 2—figure supplement 1E). As expected, some tTregs treated with TG lost their Foxp3 (Figure 3E). These results collectively argue that the truncated Ca2+ in tTregs is essential to protect tTregs from phenotypical shift.
Figure 3 with 1 supplement see all
iTregs display highly open chromatin state at the activation and differentiation-related genes.
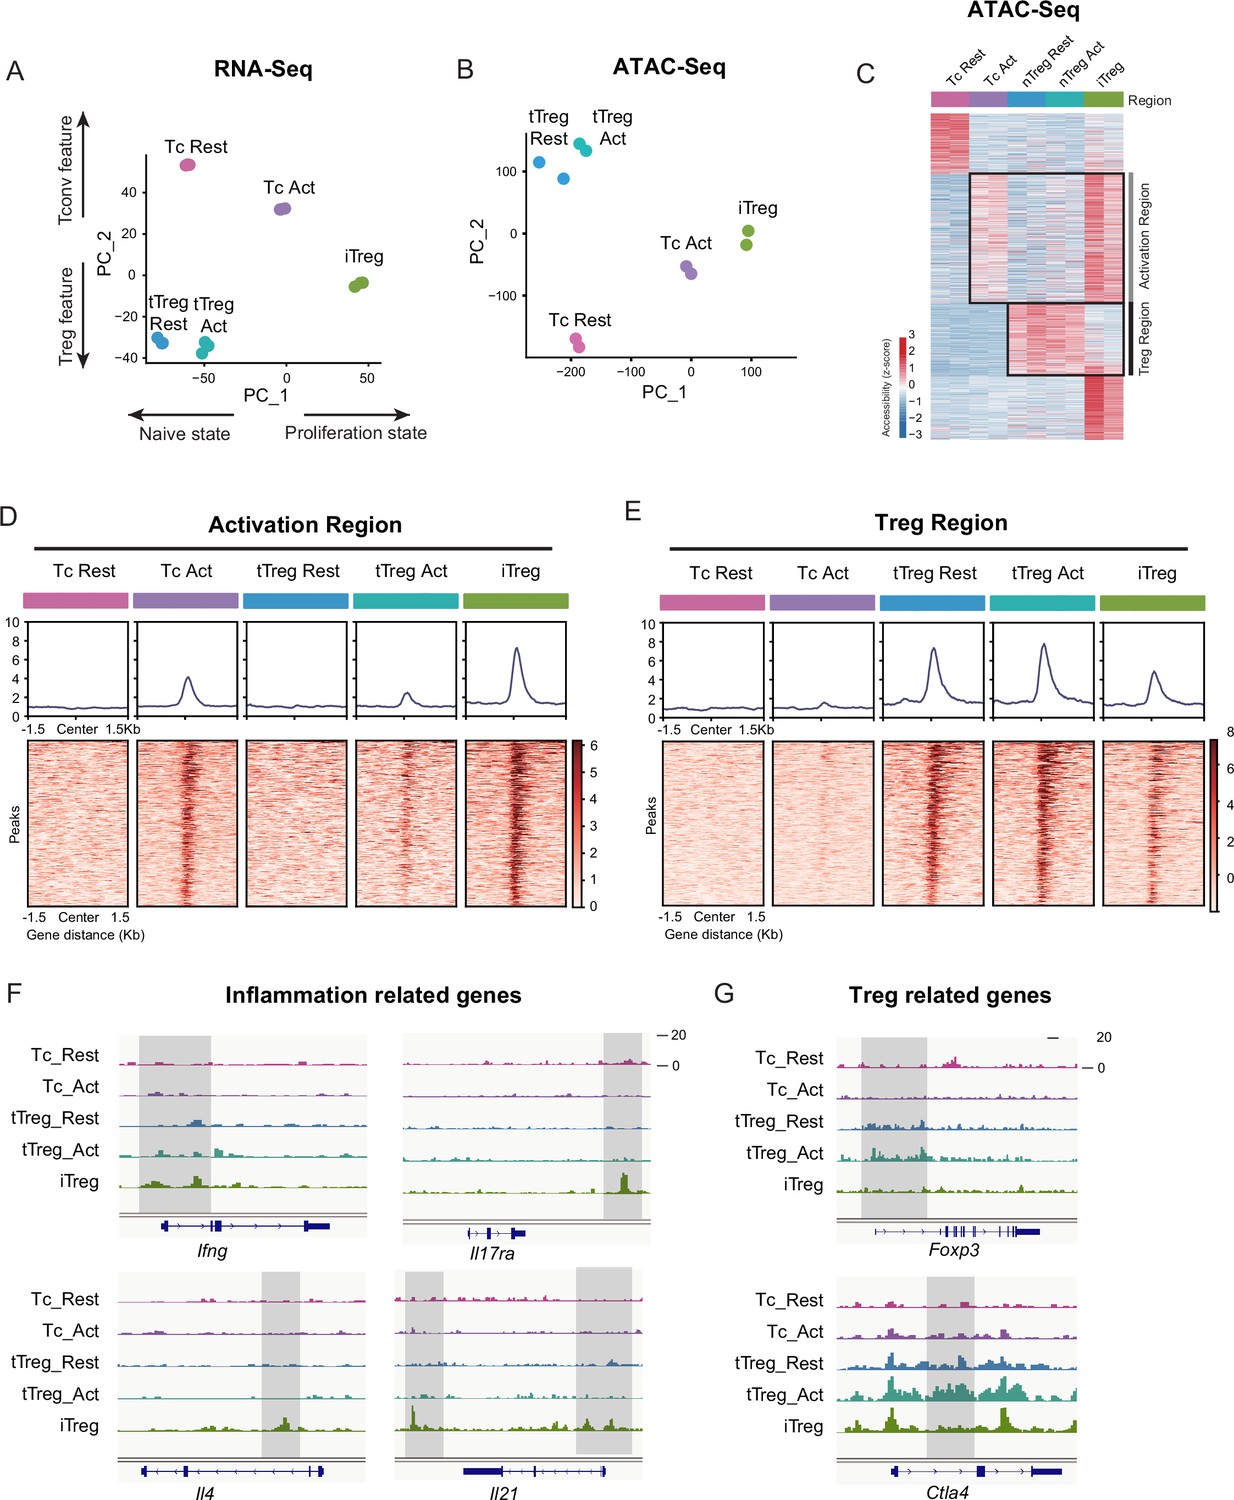
(A) Principal component analysis (PCA) visualization of transcriptional profiles of Tconvs, tTregs, and iTregs with or without TCR stimulation. Color indicates cell types. (B) PCA visualization of chromatin accessibility profiles of different cell types. Color indicates cell type. (C) Heatmap showing the chromatin accessibility of cell type specifically accessible peaks. As shown, two major groups of genes were labeled on right. (D) Line plots (top) and heatmaps (bottom) of activation regions in Tconvs, iTregs, and tTregs. Activation regions were determined by a threshold of adjusted p < 0.05 calculated by DESeq2. (E) Line plots (top) and heatmaps (bottom) of Treg regions in Tconvs, iTregs, and tTregs. Treg regions were determined by a threshold of adjusted p < 0.05 calculated by DESeq2. (F) Genomic track showing the chromatin accessibility of Ifng, Il4, Il17ra, and Il21. (G) Genomic track showing the chromatin accessibility of Foxp3 and Ctla4.
iTregs display activated chromatin state with highly open activation region
As shown, the behaviors of SOCE signaling and NFAT of iTregs were closer to their precursor Tconvs rather than tTregs, we were curious about the systemic similarity among iTregs, Tconvs, and tTregs. Therefore, we performed RNA-seq and Assay for Transposase-Accessible Chromatin with high-throughput sequencing (ATAC-seq) of iTregs, together with resting/activated tTregs and Tconvs.
In RNA-seq data, principal component analysis (PCA) and heatmap of DEG (differentially expressed gene analysis) indicated that Tconvs were quite different before and after activation, but the changes of tTregs before and after TCR activation were more limited compared with Tconvs (Figure 3A and Figure 3—figure supplement 1C), verifying that tTregs have low TCR responsiveness. Comparing the transcriptome characteristics with other cell types, iTregs acquired partial Treg features after induction, shown as an intermediate between Tconvs and tTregs on PC2 (Figure 3A and Figure 3—figure supplement 1B). While among all cell states, iTregs had the highest PC1 scores, represent higher proliferation state, probably due to the 4 days of induction (Figure 3A and Figure 3—figure supplement 1A).
Next, we analyzed the chromatin accessibility of these cells using ATAC-seq data. In the PCA plot, tTregs showed fewer changes after activation compared to Tconvs, while iTregs were closer to activated Tconv cells (Figure 3B). In differential peak heatmap clustered by cell type, Tconvs became more accessible in ‘Activation Region’ after activation, and with a dramatic increase in the overall accessibility (Figure 3C). However, the changes of tTregs after activation are limited, the majority of tTreg-specific accessible region, named ‘Treg Region’, were not changed. Also the activation region opening seen in Tconvs were not more accessible in tTregs (Figure 3C). All of these characteristics indicated that tTreg phenotype is highly ensured by their low TCR responsiveness which potentially led to their refusal to change chromatin accessibility seen in Tconvs following activation.
When comparing iTregs with the others, we found iTregs were highly accessible in activation region found in activated Tconvs (Figure 3C, D). However, only a few Treg-specific peaks shown in Treg region were opened in iTregs (Figure 3C, E). For further analysis, we isolated Treg-specific peaks. It was clear that most of them were opened in tTregs but showed little accessibility in iTregs (Figure 3—figure supplement 1D). For example, Foxp3 and Ctla4, expressed in both tTregs and iTregs, show high accessibility in resting and activated tTregs, but were closed or only partially opened in iTregs (Figure 3G). In contrast, genes related to inflammation cytokine in T helper cells, such as Ifng, Il4, Il17ra, and Il21, were highly opened in iTregs (Figure 3F). In further elaboration of Activation Region in Figure 3D, we have selected some genes including typical peaks that are within this region (Figure 3—figure supplement 1E). These genes encompass some T cell activation-associated transcription factors, such as Irf4, Atf3, as well as multiple members of the Tnf family including Lta, Tnfsf4, Tnfsf8, and Tnfsf14. Additionally, genes related to inflammation cytokine and function such as Il12rb2, Il9, and Gzmc are included. These genes display elevated accessibility upon T cell activation, partially open in activated tTreg cells. However, all of them exhibit high accessibility in iTreg cells.
Overall, we showed that at the gene expression level, iTregs have acquired some Treg features, but the chromatin accessibility was mostly trapped in activated Tconv state, not only with regard to the closed Treg genes, but also with genes associated with T activation and inflammation highly opened. The latter is expected to be mainly closed in genuine Tregs in accordance with their lower responsiveness to TCR triggering. We speculate that this ‘unconverted’ chromatin accessibility, especially the highly opened activated genes will contribute to iTreg instability upon TCR stimulation. It is therefore interesting whether NFAT accumulated in nuclei driven by sustained calcium oscillation will indeed target those genes for an activation state unfit for their phenotypical stability.
SOCE and NFAT directly leads to phenotypical instability in iTregs
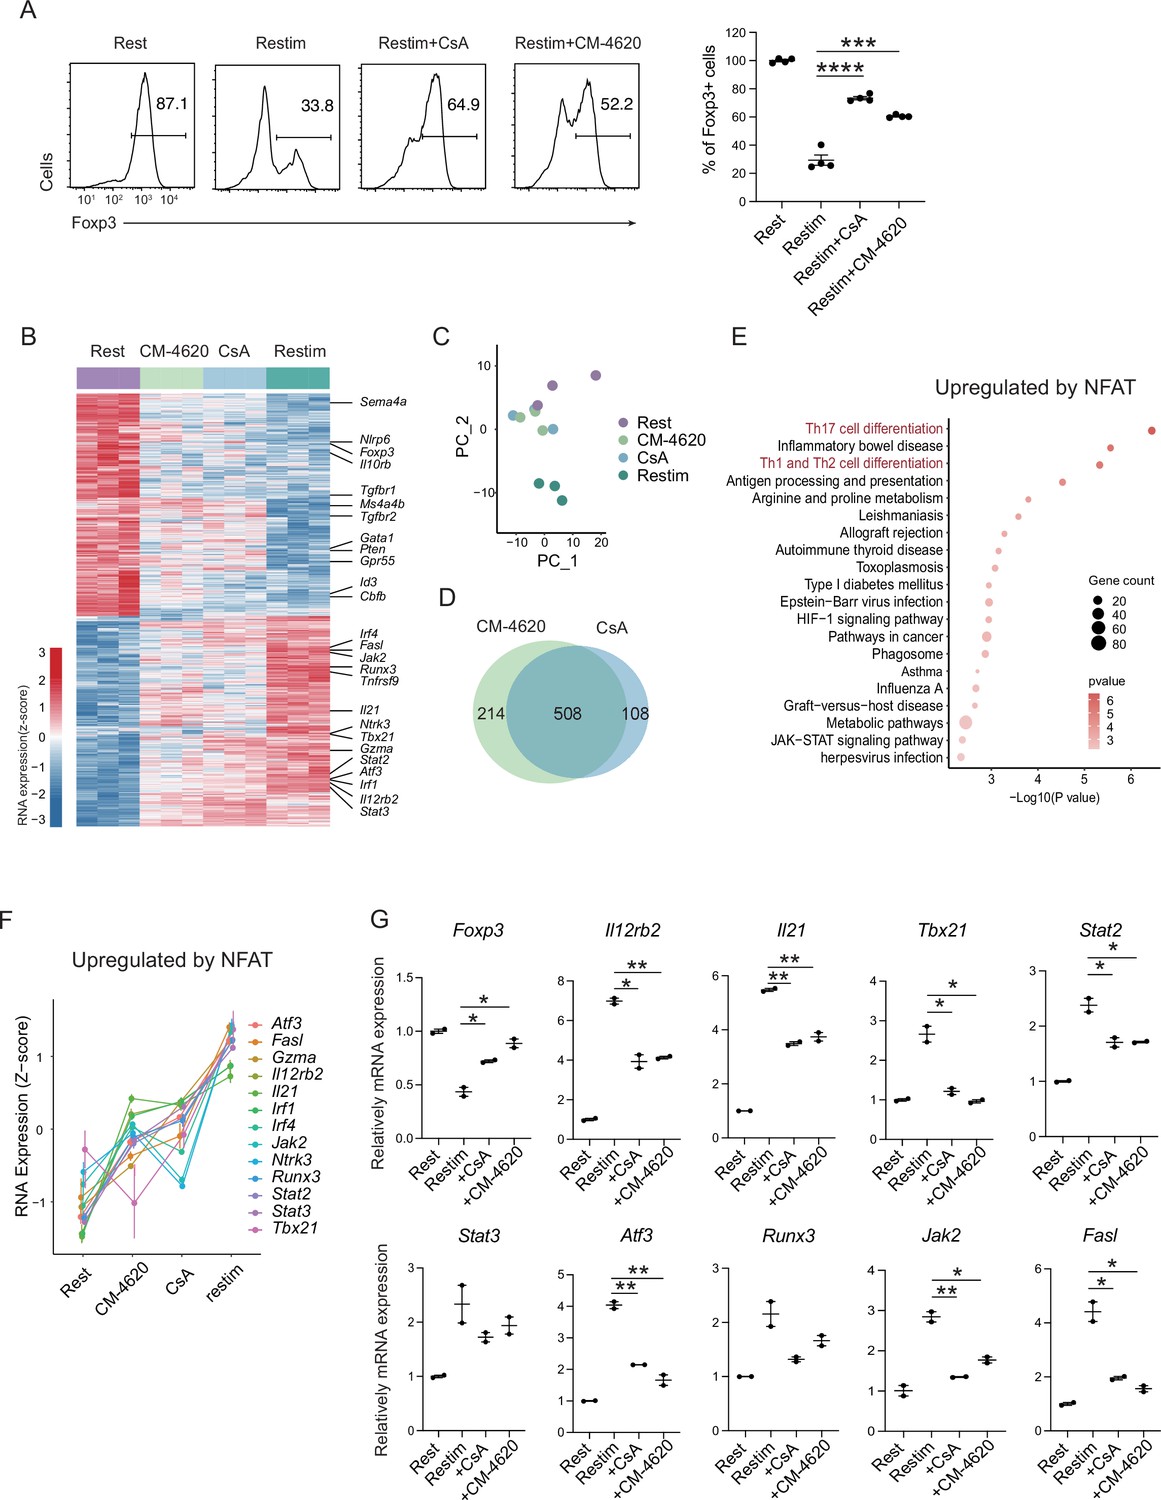
To further validate the role of calcium and NFAT in iTreg instability, we used inhibitors cyclosporine A (CsA) and CM-4620 to suppress calcium signal and NFAT, respectively. We found that inhibition of calcium or NFAT rescued the Foxp3 expression in iTregs upon restimulation (Figure 4A). Another SOCE inhibitor BTP2 was also verified (Figure 4—figure supplement 1A). Accordingly, ionomycin, which can directly induce calcium release independent of TCR activation, also lead to iTreg instability (Figure 4—figure supplement 1B). Thus, NFAT and calcium signaling blockage were correlated to iTreg stability. As control, inhibition of NF-κB (BAY 11-7082), c-Jun (SP600125), or a c-Jun/c-Fos complex (T5224) had no discernable effect, or in one case, possibly further reduction in stability (Figure 4—figure supplement 1C). These results may indicate that NFAT plays a crucial and special role in TCR activation, which leads to iTreg instability.
Figure 4 with 1 supplement see all
Store-operated calcium entry (SOCE) signaling and NFAT can disrupt iTreg stability.
(A) Impact of calcium signal and NFAT on iTreg stability. Sorted Foxp3-GFP+ iTregs were rested for 1 day, then restimulated by anti-CD3 and CD28 in the presence of cyclosporine A (CsA) and CM-4620. Percentages of Foxp3+ cells were analyzed by intracellular staining after 2-day restimulation. Left, representative histograms of CsA and CM-4620-treated iTregs. Right, graph for the percentages of CsA and CM-4620-treated Foxp3+ cells in all CD4+ cells. n = 4, N = 8. (B) Heatmap showing the decreased changes for restimulated iTregs with CM-4620 or CsA. Typical genes were highlighted. (C) Principal component analysis (PCA) visualization of transcriptional profiles of iTregs at different states. Color indicates cell states. (D) Venn plot showing the overlap of DEGs rescued by adding CM-4620 or CsA. (E) Biological terms enriched by the significant upregulated genes after iTreg restimulation rescued by inhibiting calcium or NFAT. (F) Representative genes upregulated after iTreg restimulation rescued by inhibiting calcium or NFAT. (G) QPCR of Foxp3 and Th-differentiated gene expression in the resting, restimulated and CsA/CM-4620-treated iTregs. Here, *p < 0.05; **p < 0.01; ***p < 0.001; ****p < 0.0001, by Student’s t-test.
-
Figure 4—source data 1
iTreg stability, QPCR of related gene expression upon activation after CsA and CM-4620 blockade.
- https://cdn.elifesciences.org/articles/88874/elife-88874-fig4-data1-v1.xlsx
To investigate how NFAT and calcium signaling destabilize iTregs, we performed RNA-seq on these cells. From the differential gene expression and PCA, we found that iTregs upon restimulation showed significant differences from the resting state at the transcriptome level, and this difference could be substantially reduced with inhibition of calcium or NFAT (Figure 4B). As shown in the PCA plot, calcium/NFAT-blocked iTregs were significantly closer to the resting state than the unstable ones (Figure 4C). Thus, inhibition of calcium or NFAT can significantly improve the stability of iTregs as reflected by transcriptomic identity. In addition, the large overlap (about 80%) of genes that were rescued by CM-4620 and by CsA further supported that calcium signaling change the fate of iTregs mainly through NFAT (Figure 4D).
Among the genes rescued by CM-4620 and CsA, they can be further divided into two groups. Members of the first group were downregulated upon restimulation and the downregulation was blocked by inhibition of calcium and NFAT. This result indicating that these genes are downregulated by NFAT. Among these genes, several of them are critical for functions and stability of Tregs, such as Foxp3, Id3, Il10rb, Sema4a, Tgfbr1/2, Ms4a4b, and Nlrp6 (Figure 4B and Figure 4—figure supplement 1D). In the functional analysis of these genes, we found that Rap-1 pathway, PD-1/PD-L1 pathway and Foxo pathway were significantly enriched (Figure 4—figure supplement 1E). Loss of these genes was therefore consistent with the phenotype of iTreg instability.
The other group had genes that were otherwise upregulated after restimulation, but failed to do so with CM-4620 or CsA, indicating that these genes are upregulated by NFAT. In these genes, many of them are associated with T helper differentiation and T cell activation, such as Il21, Il12rb2, Tbx21, Gzma, Stat2, Stat3, Atf3, and Fasl (Figure 4B, F). Among them, Il21 encodes a key cytokine in Th17 differentiation, Tbx21, encoding T-bet, and Il12rb2 are key transcriptional factors and cytokine receptor for Th1 differentiation. Functional enrichment analysis of these upregulated genes pointed to Th17 related pathway and Th1/Th2 related pathways (Figure 4E). Further validation of these upregulation T helper related genes (TH genes) by NFAT was perform by QPCR (Figure 4G). These results in all indicated the iTreg restimulation was associated with a strong tendency of differentiation toward non-Treg polarization, and NFAT was likely a key regulator in this process.
NFAT upregulate prime-opened TH genes to destabilize iTregs
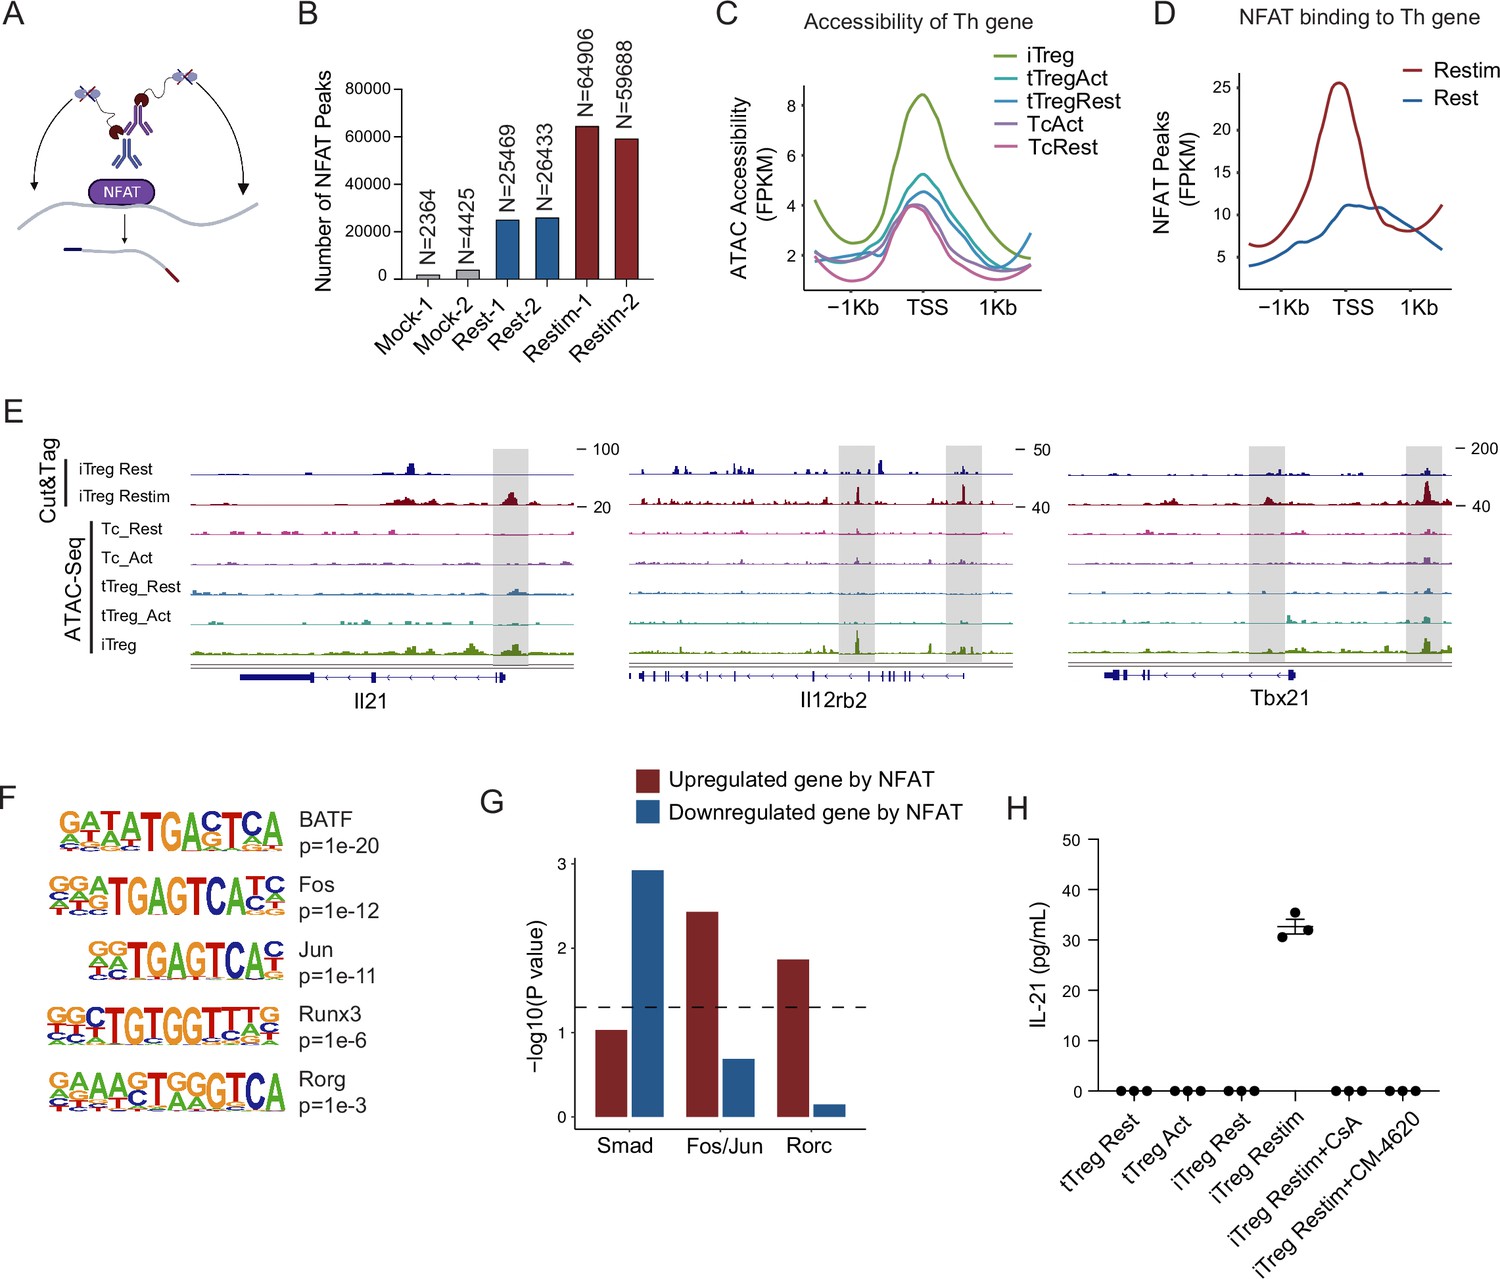
To further study the role of NFAT in iTreg instability, we performed Cut&Tag assay to acquire the NFAT-binding sites in resting iTregs and those after restimulation (Figure 5A). NFAT-flag and anti-Flag antibody were used to capture peaks that were bound by NFAT (Figure 5—figure supplement 1A). The binding peaks were of high quality as indicated by the lower number of peaks in the mock control compared to both resting and activated states (Figure 5B). The number of NFAT peaks in restimulated iTregs was significantly higher than that in resting state, which was consistent with the massive nuclear translocation of NFAT indicated by western blot (Figure 5B and Figure 2D). For peak distribution at gene body, NFAT peaks both before and after restimulation were enriched at promoters/transcription start site (TSS) and the first introns of genes (Figure 5—figure supplement 1C).
Figure 5 with 1 supplement see all
NFAT disrupt iTreg stability by upregulating prime-opened TH genes.
(A) Model of CUT&Tag experiments to capture the binding sites of NFATc1. (B) The number of NFAT Cut&Tag peaks in mock control, resting iTregs, and restimulated iTregs. (C) Normalized counts of ATAC-seq reads in resting and activated Tconvs, resting and activated tTregs and iTregs, centered on the transcription start site (TSS) region of NFAT-upregulated TH genes. (D) Normalized counts of NFAT Cut&Tag reads in resting and restimulated iTreg, centered on the TSS region NFAT-upregulated TH genes. (E) Genome track visualization of NFAT-binding profiles and chromatin accessibility profiles in typical genes Il21, Il12rb2, and Tbx21. (F) Motif enriched in peaks with higher NFAT Cut&Tag signals in restimulated iTreg versus resting iTreg. List of five representative motifs ranked based on the p-values. The enrichment was performed by using HOMER. (G) The enrichment of motif occurrence for typical NFAT cofactors Smad, Fos/Jun, Rorc in the NFAT peaks in NFAT-upregulated or -downregulated genes after restimulation. p-value was from Fisher’s exact test. (H) IL-21 secretion in tTreg and iTreg upon activation. iTregs and tTregs were sorted and restimulated with anti-CD3 and anti-CD28 antibodies, in the presence of cyclosporine A (CsA) and CM-4620. Cell culture supernatants were harvested after 2-day restimulation and IL-21 secretion was analyzed by ELISA. n = 3.
-
Figure 5—source data 1
IL-21 secretion in tTreg and iTreg upon activation.
- https://cdn.elifesciences.org/articles/88874/elife-88874-fig5-data1-v1.xlsx
For those upregulated TH genes, we speculated that this may be associated with the highly ‘activated’ chromatin state of iTregs mentioned earlier. Therefore, we first checked the chromatin accessibility around the TSS in those genes and found that this group of genes was significantly more accessible in iTregs than in tTregs and Tconvs (Figure 5C). As shown in the genome browser view, Il21, Il12rb2, and Tbx21 were more open in iTregs, even more so than the activated Tconvs (Figure 5—figure supplement 1B). Further analysis revealed that NFAT significantly increased their binding to the TSS regions on upregulated Th genes after restimulation (Figure 5D), while showing little change on downregulated Treg genes (Figure 5—figure supplement 1D). As shown by Il21, Tbx21, and Il12rb2, after activation, NFAT accumulated at the sites that were prime-opened resulting in their increased expression (Figure 5E). Therefore, the enhanced chromatin accessibility revealed in Figure 4 was indeed approached by the large amount of NFAT, leading to T cell polarization toward other directions with a sole reciprocal loss of polarization toward Tregs. This tendency may to some extent explain the rapid loss of iTreg phenotype.
As one potential counter argument, NFAT is ostensibly essential to the development of tTregs (Li et al., 2014; Zheng et al., 2010). In the induction of iTregs, NFAT in collaboration with SMAD is also critical (Vaeth et al., 2012; Zheng et al., 2010; Tone et al., 2008). It is therefore intriguing why NFAT re-activation after iTreg formation may serve as a key factor in compromising iTreg stability. To resolve those seemingly contradictory regulations, we performed NFAT motif enrichment analysis. The results showed that putative BATF, AP-1(Fos/Jun), and RORg-binding sites were highly enriched in restimulation state specific regions (Figure 5F). For the preference of different cofactors to different gene subsets, SMAD family tended to bind to genes that were downregulated by NFAT, for example, Foxp3, while AP-1 and RORg preferred binding to genes that were upregulated by NFAT, such as TH genes (Figure 5G). Taken together, our results appear to suggest that upon restimulation of iTregs, NFAT prefers to cooperate with AP-1/RORg to promote the expression of prime-opened TH gene expression, and at the same time denies the SMAD programming that may be critical to maintain Treg functions and stabilities. Certainly, how much this selective cooperation between NFAT and other transcriptional factors contributes to iTreg instability remains speculative until large-scale ChIP-seq analyses are performed on the players involved.
According to the Cut&Tag data, the secretion levels of IL-21 in tTreg and iTreg were also examined by ELISA. As shown in Figure 5H, tTreg did not secrete IL-21 regardless of activation status (undetectable), while iTreg did not secrete IL-21 at resting state but they did so after 48 hr of restimulation (Figure 5H). The secretion of IL-21 was inhibited by CsA and CM-4620 treatment. This observation aligns with our findings where nuclear binding of NFAT to gene loci of these cytokines enhanced their expression, pushing iTreg unstable under inflammatory conditions. These findings further underscore the likelihood that the inhibition of calcium and NFAT signaling might contribute to the stabilization of iTreg by suppressing the secretion of inflammatory cytokines.
Reduction of SOCE enhances iTreg stability and suppressive potential
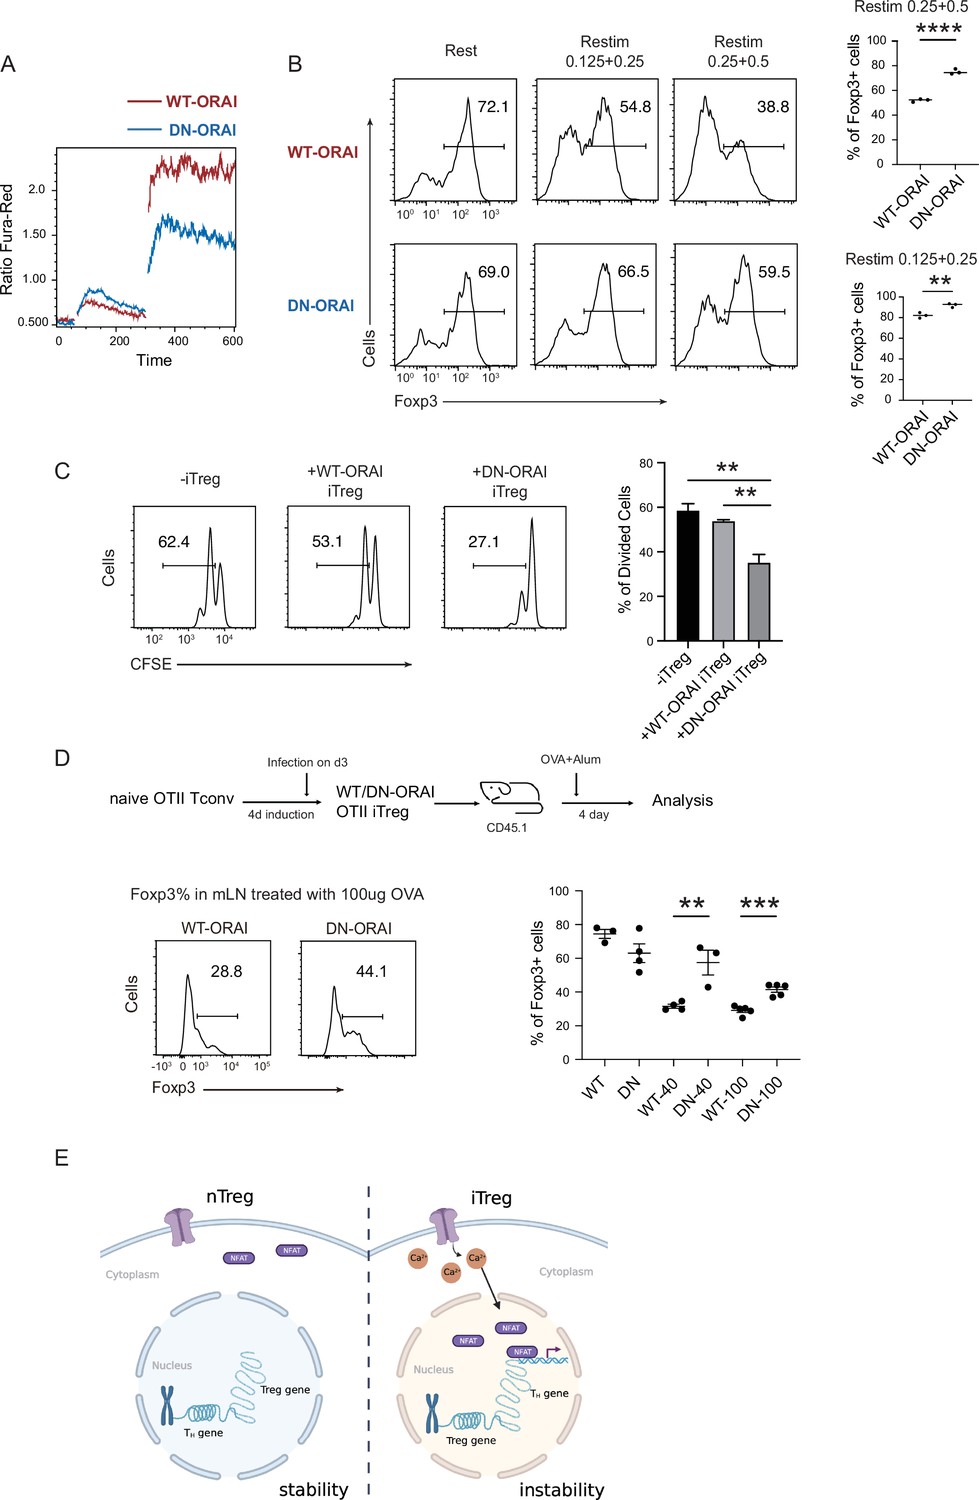
Given that sustained calcium signal and NFAT translocation can directly disrupt iTreg stability, we asked whether manipulation of calcium signaling or NFAT can conversely be used to stabilize those cells. As Treg suppression assays require the participation of other T cells which are sensitive to inhibitory agents added indiscriminately, after regular iTreg induction, we overexpressed a dominant negative ORAI (DN-ORAI), whose single monomer incorporation will lead to a functionally disabled ORAI hexamer, to control the SOCE signal upon iTreg restimulation (Mignen et al., 2008). As expected, the mutated ORAI reduced the SOCE signaling by about a half (Figure 6A). When we restimulated this DN-ORAI expressing iTregs with anti-CD3/CD28, they showed stronger stability with higher retention of Foxp3 than WT-ORAI iTregs (Figure 6B). Consistently, DN-ORAI iTregs displayed more potent suppressive activity than control iTreg in in vitro suppression assay (Figure 6C).
Figure 6 with 1 supplement see all
Manipulation of store-operated calcium entry (SOCE) can enhance iTreg stability.
(A) Manipulation of SOCE signal by dominant negative ORAI (DN-ORAI). SOCE was recorded in DN-ORAI iTreg cells loaded with Fura-Red by flow cytometry, TG was added after 1 min to induce ER depletion, 5 min later 2 mM calcium was added to induce calcium influx. N = 3. (B) Stability of iTreg was enhanced by DN-ORAI. iTregs were infected with WT-ORAI and DN-ORAI, and then restimulated by anti-CD3 and CD28 for 2 days. Percentages of Foxp3 were analyzed by intracellular staining. Left, representative histograms of Foxp3 expression in DN-ORAI iTregs. Right, graph for the percentages of Foxp3+ cells in all CD4+ cells. n = 3, N = 3. (C) DN-ORAI enhances iTreg suppressive capacity. CFSE-labeled OT-II T cells were stimulated with OVA-pulsed DC, Foxp3-GFP+ WT-ORAI/DN-ORAI iTregs were added to the culture to suppress the OT-II proliferation. After 40 hr, CFSE dilutions were analyzed. n = 3, N = 3. (D) Stability of DN-ORAI iTreg in vivo. WT-ORAI/DN-ORAI-GFP+-transfected CD45.2+ Foxp3-RFP+ OT-II iTregs were transferred i.v. into CD45.1 mice. Recipients were immunized with OVA323-339 in Alum adjuvant. On day 5, mLN and spleen were harvested and analyzed for Foxp3 expression by intracellular staining. Up, schematic representation of adoptive transfer experiment. Bottom right, histograms of Foxp3 expression in CD4+CD45.1+ cells in spleen and mLN; bottom left, graph for the percentages of Foxp3+ cells in all CD45.2+ cells in mLN. n = 3, N = 3. (E) Proposed model. The diminished calcium signal and closed chromatin structure in tTregs protect them from genetic and epigenetic disturbances, and the sustained calcium signal in iTregs cause NFAT aggregation in the nucleus, which makes use of a pre-opened gene loci to upregulate TH genes, thus resulting the instability of iTregs. Here, **p < 0.01; ***p < 0.001; ****p < 0.0001, by Student’s t-test.
-
Figure 6—source data 1
Store-operated calcium entry (SOCE) signal, iTreg stability in vitro and in vivo after over-expression DN-ORAI.
- https://cdn.elifesciences.org/articles/88874/elife-88874-fig6-data1-v1.xlsx
Finally, the stability of DN-ORAI iTregs in vivo was examined. In brief, OT-II iTregs were infected with DN-ORAI retrovirus and then purified by GFP fluorescence, then the CD45.2+ GFP+ Foxp3-RFP+ iTregs were adoptively transferred into CD45.1 recipient, and OVA/Alum were administrated to restimulate DN-ORAI iTregs in vivo. Analysis of the percentage of Foxp3+ cells in mLN 5 days after adoptive transfer showed that DN-ORAI iTregs were more resistant to the loss of Foxp3 and thus were more stable than control WT-ORAI iTregs (Figure 6D). These results collectively showed that weakened calcium signal and inhibition of NFAT can quantitatively prevent iTregs from losing more Foxp3 both in vitro and in vivo, thus permitting a stronger suppressive capacity and a longer stability.
Based on extensive opening of activation regions approached by NFAT in the process iTreg stimulation, we postulate that openness of activation region could be another crucial feature of Treg stability, in addition to closed Treg region by low TSDR (Treg-specific demythylated region). Beyond the basal regimens of anti-CD3, anti-CD28, IL-2, and TGF-β, several additional factors have been reported to enhance the stability of iTregs, including the use of retinoic acid, rapamycin, vitamin C, and AS2863619 as well as removal of CD28 signaling (Akamatsu et al., 2019; Hill et al., 2008; Mikami et al., 2020; Yue et al., 2016; Zhang et al., 2013). We observed if those new additions in some ways altered the state of TSDR as well as the the openness of activation region. Our findings revealed that rapamycin and AS tended to close the activation region (Figure 6—figure supplement 1A), while Vc, removal of CD28, and AS increased the accessibility of Treg genes (Figure 6—figure supplement 1B). These results indicate that different treatments have varied impacts on the activation region and Treg region. Hence, the selective and combinatorial use of those factors is an interesting proposal in the generation of more stable iTregs.
Discussion
tTregs are different from other subsets of CD4 T cells in the thymic determination of their phenotype. To some extent, this centric determination is closer to CD4/CD8 demarcation, rather than other polarizations in the peripheral environment (Rudensky, 2011; Sakaguchi et al., 2008). The stable phenotype, even after activation, is critical to provide the baseline immune suppression (Rubtsov et al., 2010). pTregs/iTregs are driven by the environment. It is logical that those cells should be deprived of their suppressive ability when are no longer needed to avoid unnecessary accumulation of those cells. The current understanding is that during thymic development, Foxp3 CNS2 region is selectively demethylated, allowing several transcriptional factors, such as Ets1 and Foxp3 itself to binding to this location (Samstein et al., 2012; Ohkura et al., 2012). This is one of several epigenetic features that maintain the stability, and TCR signaling in tTregs does not change the pre-established hypomethylation state. Induced Tregs, on the other hand, use a different program that relies on the binding of SMADs to the CNS1 region to initiate Foxp3 expression (Tone et al., 2008). This SMAD binding mediated transcription is dependent on Foxp3 H3K4me3 modification. In the absence of SMAD, H3K4me3 is partially lost, resulting in iTreg phenotypical shift (Tone et al., 2008). Withstanding this paradigm, iTregs do not immediately lose Foxp3 expression upon TGF-β withdrawal, the loss of Foxp3 is evident hours or days after TCR signaling (Selvaraj and Geiger, 2007). This indicates that while the epigenetic alterations are necessary, an activation event is required to drive the loss of phenotype. This notion is subtly echoed by the limited TCR signaling in tTregs, implying that the hyporesponsiveness to TCR ligation may be a critical feature to maintain their stability.
We observed differences between tTregs and iTregs in calcium signal and Th gene accessibility. tTregs utilize both truncated calcium signal and conserved chromatin accessibility to systematically reduce their TCR responsiveness, ensuring their stability. In contrast, iTregs retain the full strength of the TCR signaling, particularly the sustained vibration of SOCE signal, the key factor that drives NFAT synthesis and nuclear translocation. With the help of several cofactors, such as AP-1, NFAT caused the high expression of these TH genes, which subsequently subverts the original differentiation of iTregs, leading to their instability. Direct inhibition of SOCE signaling and NFAT can enhance iTreg stability in vitro and in vivo (Figure 6E).
Previous observations also showed that the calcium signal in tTreg is weaker than that in Tconvs, and NFAT activity is suppressed in tTregs. The weaker Ca2+ signal in previous reports was seen as early as 10 min into activation, this contradiction likely reflects the experimental settings and stimulation strength (Yan et al., 2015). Nevertheless, in line with our results, inhibition of NFAT by low-dose CsA increased the number of tTreg in atopic dermatitis patients (Brandt et al., 2009). It seems reasonable to establish an inverse association between SOCE signal and Treg stability. In our analysis of the RNA-seq and chromatin accessibility data, we did not identify any particular mechanism that may account for the distinct Ca2+ signal patterns in tTregs and iTregs. However, in contrast to Tconvs and iTregs, there must be a negative signal loop that blunts SOCE vibration in tTregs. We tried to sustain the calcium signaling in tTregs forcibly by thapsigargin, and indeed observed loss of Foxp3. However, as we at the moment cannot appreciate the finesse of this regulation, the underlying molecular details will require much more delicate approaches rather the brutal force of ER store depletion. In our view, future investigation in this direction may lead to better understanding of Treg biology as well as innovations in clinical Treg cell therapy.
Our results are consistent with the understanding that Treg-specific hypomethylation is crucial for tTregs to stably express their Treg-specific genes (Samstein et al., 2012; Ohkura et al., 2012). Those epigenetic changes are mostly absent in iTregs, resulting in their instability. The differences of accessibility in Treg genes were also observed in our ATAC-seq data. Therefore, current treatments such as vitamin C and CD28 blockage applied to achieve demethylation and accessibility of Treg genes in iTregs are worthy attempts (Mikami et al., 2020; Yue et al., 2016). However, our work indicates that at least in ATAC-seq analyses, there are a cluster of activation and differentiation-related peaks present in iTregs that remain silent in tTregs upon TCR stimulation. Critically, these peaks were targeted by abundant NFAT in the iTreg nuclei following activation, leading to the upregulation of Th genes. This tendency of deviation away from Tregs may be another key player to iTreg instability. Our effort to produce highly stable iTregs would likely require a combined approach to demethylate Treg-specific genes and at the same time to block the activation and differentiation-related genes. In our work, targeting NFAT signaling during the restimulation phase appeared to be a potential method. Other ways that can directly close these genes will also likely be beneficial.
In this work, we stress the importance of NFAT signal in the instability of iTregs. Previous research has also unveiled the adverse effects of other TCR signaling pathways on Treg stability, such as NF-κB and mTOR. As all those factors may contribute to the shift in phenotype, it is out of scope of this report to directly compare all those factors. However, the value of this report is the identification of a key difference in Ca2+ signaling under TCR ligation that may explain the stability differences between iTregs and tTregs, which may open the door for additional regulations given the key role of SOCE activity in T cell activation.
Methods
Mice
All mice were in CD45.2 C57BL/6 background unless noted otherwise. OT-II-transgenic mice and CD45.1 mice were purchased from Jackson Laboratories. Foxp3-IRES-GFP transgenic mice (B6.Cg-Foxp3tm2Tch/J, Strain #:006772 from Jackson Laboratory) were a gift from Dr. Hai Qi, School of Medicine, Tsinghua University. Foxp3-RFP mice were a gift from Dr. Xuyu Zhou, Institute of Microbiology, Chinese Academy of Sciences (CAS). Wild-type mice were purchased from Beijing Vital River Laboratory Animal Technology Co., Ltd. All mice were bred and housed at Tsinghua University Animal Facilities and maintained under specific pathogen-free conditions. This study was performed in strict accordance with the recommendations in the Guide for the Care and Use of Laboratory Animals of the National Institutes of Health. All of the animals were handled according to approved Institutional Animal Care and Use Committee (IACUC) protocols of the Tsinghua University. The protocol was approved by the Committee on the Ethics of Animal Experiments of the Tsinghua University (22-SY6). All surgery was performed under sodium pentobarbital anesthesia, and every effort was made to minimize suffering.
Antibodies and reagents
Recombinant human IL-2 and human TGF-β were from R&D systems. Anti-mouse CD3 and biotin-anti-CD3 (145-2C11) mAb, anti-mouse CD28, and biotin-anti-CD28 (37.51) mAb purified streptavidin were all from biolegend. LIVE/DEAD Fixable Aqua were from Invitrogen. For flow cytometric analysis, in addition to CD45.1 (A20) monoclonal antibody from Invitrogen, others were purchased from eBioscience or BD Pharmingen. The following clones were used: Foxp3 (150D/E4), CD45.2 (104), CD4 (GK1.5), CD25 (PC61.5), CD44 (IM7), and CD62L (MEL-14). Antibody used in immunoblot including NFATc1 Antibody (7A6) and NFATc2 Antibody (4G6-G5) were from Santa Cruz, Lamin A/C (4C11), β-Actin (13E5), and GAPDH (D4C6R) mAb were from CST. Monoclonal ANTI-FLAG M2 antibody used in Cut&Tag assay was from Sigma. Mouse CD4 T Cell Isolation Kit used for the enrichment of CD4+ T cells was from Stem cell. Foxp3/Transcription Factor Staining Buffer Set for Foxp3 staining was from eBioscience. NE-PER Nuclear and Cytoplasmic Extraction Reagents used for immunoblot was from Thermo. All sequencing kit, including TruePrep DNA Library Prep Kit V2, Hyperactive Universal CUT&Tag Assay Kit, and TruePrep Index Kit V2, was from Vazyme. For calcium mobilization, Ionomycin was from Beyotime and thapsigargin from Invitrogen. For inhibitors, cyclosporin A, CM-4620, and BTP2 were all from MCE. OVA323–339 peptides from MBL. For calcium imaging, Fluo-4 AM was from Thermo and Indo-1 AM from BD.
Flow cytometry sorting and FACS
For surface marker detection, cells were incubated with Fc blocker (CD16/32 antibody; 2.4G2) for 5 min, and then incubated with surface antibody for 15 min at room temperature avoiding light. Foxp3 intracellular staining was performed by cell fixation and permeabilization using the Foxp3/Transcription Factor Staining Buffer Set. Samples were analyzed on Fortessa cytometers (BD) with FACS Diva software and data were analyzed with Flowjo.
To prepare Tconv, tTreg, and iTreg for experiments, spleen was isolated from 2- to 4-month-old Foxp3-GFP mice for Tconv and tTreg sorting, and 6-week-old mice for iTreg induction. Subsequently, CD4+ T cells were enriched using CD4 Isolation kit and stained with indicated surface markers. FACSAriaII (BD) was used for collecting particular population. The cell populations used are as follows: naive T cells, CD4+ Foxp3-GFP+ CD44low CD62Lhigh; tTreg cells, CD4+ Foxp3-GFP+; iTreg, Foxp3-RFP+ or Foxp3-GFP+. Infected iTreg, Foxp3-RFP+ MSCV-GFP+.
In vitro iTreg induction and restimulation
CD4+Foxp3-GFP− CD62LhiCD44lo (or Foxp3-RFP−) naive T cells were sorted using 6-week-old mice and stimulated with plate-bound 0.5 μg/ml anti-CD3 and 1 μg/ml anti-CD28 in the presence of 2 ng/ml human TGF-β and 200 U/ml rhIL-2. iTreg was induced for 4 days and sorted using Foxp3-GFP/RFP fluorescence, then cells were rested in fresh RPMI complete medium containing 200 U/ml rhIL2 for 1 day.
For iTreg restimulation, iTreg was harvested plated at 0.4 × 10⁶ cells for restimulation with plate-bound 0.5 μg/ml anti-CD3 and 1 μg/ml anti-CD28 in 96 plate. After 2-day restimulation, Foxp3 was analyzed by intracellular staining.
Calcium measurement
For calcium influx within 10 min upon TCR activation, sorted Foxp3-RFP− Tconv, Foxp3-RFP+ tTreg and Foxp3-GFP+ iTreg were resting for 1 day, then mixed and loaded with 1 μM Indo-1 AM at 37°C for 30 min in RPMI medium without fetal bovine serum (FBS). Cells were then washed for twice in cold RPMI medium containing 1% FBS, followed by staining with biotinylated anti-CD3 and biotinylated anti-CD28 on ice for 1 hr. For calcium measurement, cells were heated in 37°C water bath for 5 min, then the baseline was recorded for 60 s on LSR II(BD). Calcium influx was triggered by the addition of 100 μg/ml streptavidin to crosslink TCR. Data were analyzed using kenetics in FlowJo.
For calcium oscillation within 1 hr, Foxp3-RFP− Tconv, Foxp3-RFP+ tTreg, and Foxp3-RFP+ iTreg were sorted and rested for 1 day, then cells were loaded with Fluo-4 AM at 37°C for 30 min. After washing twice with phosphate-buffered saline and further incubating in RPMI medium for 10 min, cells were activated by plate-bound 0.5 μg/ml anti-CD3 and 1 μg/ml anti-CD28 in poly-L-lysine-coated confocal dish. Excess non-adherent cells were removed by flushing with buffer solution after 10 min. Fluorescence were recorded in the indicated time after stimulation as a time lapse for 20 min with an interval of 6 s. The mean fluorescence intensity changes over time in single cells were analyzed using Surface in Imaris and normalized to resting fluorescence F0 (Fluo-4 F/F0), further the standard deviation of F/F0 in single cells was calculated and presented using GraphPad.
Immunoblot
iTreg, tTreg, and Tconv were rested for 1 day in RPMI medium containing rhIL-2 and treated with CsA for 30 min before activated. Then these cells were stimulated by plate-bound 0.5 μg/ml anti-CD3 and 1 μg/ml anti-CD28 for indicated time, in the absence or presence of TGF-β. After stimulation, cells were immediately lysed using CERI, then nuclear and cytoplasmic component were separated using NE-PER Nuclear and Cytoplasmic Extraction Reagents. After being mixed with sodium dodecyl sulfate loading buffer and boiled for 10 min, the cytoplasmic and nuclear proteins equal to 5 × 10⁵ iTreg and 2 × 10 6 tTreg/Tconv were loaded onto 7.5% PAGE Gels. Then the protein was transferred onto a NC membrane and immunoblotted with NFATc1 and NFATc2, Actin and GAPDH were used as loading control of cytoplasmic protein, and LaminA/C as nuclear. Finally, the immunostained bands were detected by Super ECL Detection Reagent.
Treg cell suppression assay in vitro
104 purified DCs from splenocytes were pulsed with 2 μg/ml OVA323–339 peptide, then iTreg and tTreg (2 × 10⁴) were added onto DCs to occupy the latter for 30 min. CD25− OTII Tconv cells were sorted and stained by CFSE (Thermo Fisher Scientifc). 2 × 10⁴ OTII Tconv cells were mixed in DC-Treg culture in a 96-well U bottom plate. The proliferation of OTII T cells was assessed after 2–4 days by CFSE dilution on flow cytometry.
DN-ORAI and NFAT-flag construction and retrovirus infection
For DN-ORAI, ORAI CDS sequences were amplified from cDNA library and mutated with primer. Then WT-ORAI and DN-ORAI were linked with MSCV-GFP vector. For NFAT-Flag, Nfatc1-flag CDS was amplified from TetO-FUW-flag-Nfatc1 plasmid, and further linked with MSCV-GFP vector. For retrovirus production, platE cells were cultured with Dulbecco’s modified Eagle medium containing 10% FBS to 80–90% confluence. For each 10 cm dish, 10 µg MSCV plasmid and 10 µl Neofect transfection reagent were mixed in 500 µl Opti-MEM medium. After 30-min incubation, the DNA mixture were added into the well and gently mixed. After 48 and 72 hr, supernatant containing viruses was collected, filtered with 0.45 µm membrane. 8 µg/ml polybrene was added to virus supernatant, then Foxp3-RFP+iTreg was infected on the days 2 and 3 of induction by centrifugation at 1500 × g, 37°C 2 hr. On the day 5 of induction, the infected cells with GFP fluorescence and Foxp3-RFP iTreg was sorted and used.
In vivo iTreg stability
CD45.2+ Foxp3-RFP+ iTreg was sorted, and washed twice. 5 × 10⁶ cells were adoptively transferred into CD45.1 mice via tail vein. For DN-ORAI iTreg, CD45.2+ Foxp3-RFP+ iTreg was infected and GFP+RFP+ iTreg was sorted to transfer to CD45.1 recipient. Six hours after cell transfer, mice were immunized with OVA protein mixed with Alum adjuvant in each hind flank. After 4 days of immunization, mLN were collected and the percentage of Foxp3+ cells in CD45.2+ was analyzed by intracellular staining.
AFM-based single-cell force spectroscopy
The experiments were performed as previously described using a JPK CellHesion unit (Chen et al., 2017; Flach et al., 2011). In brief, to measure Treg-DC adhesion forces in bicellular system, DC2.4 cells were cultured on untreated glass disks. iTreg/tTreg/Tconv cells were sorted and rested with rhIL2 overnight. The disks were moved into an AFM-compatible chamber and mounted on to the machine stage. The incubator chamber in which the machine was housed was conditioned at 37°C and at 5% CO2. A clean cantilever was coated with CellTak (BD), and then used to glue individual iTreg/tTreg/Tconv cells added to the disk. Only round and robust cells were selected for AFM gluing. The AFM cantilever carrying a single iTreg/tTreg/Tconv cell was lowered to allow T cell contact with an individual DC and to interact for 15 s before being moved upwards, until two cells were separated completely. The force curves were acquired. The process was then repeated. For each SCFS experiment, a pair of T–DC was used to generate force readings from each up and down cycle over a period of several minutes, a minimum of 14 force curves were collected in each T–DC pair. In all experiments, at least three such pairs were used for each condition. The force curves were further processed using the JPK image processing software.
RNA-seq
The RNA-seq library preparation was performed by a modified SMART-seq2 protocol (Habib et al., 2016; Picelli et al., 2014). Briefly, RNA was added into 4 µl elution mix made of 1 µl RT primer (10 µM), 1 µl dNTP mix (10 mM each), 1 µl RNase inhibitor (4 U/µl), and 1 µl H2O. Eluted samples were incubated at 72°C for 3 min and immediately placed on ice. Each sample was added with 7 µl reverse transcription (RT) mix made of 0.75 µl H2O, 0.1 µl Maxima RNase-minus RT (Thermo Fisher Scientific, #EP0741), 2 µl 5× Maxima RT buffer, 2 µl Betaine (5 M, Sigma-Aldrich, B0300), 0.9 µl MgCl2 (100 mM), 1 µl TSO primer (10 µM), and 0.25 µl RNase inhibitor (40 U/µl). The RT reaction was incubated at 42°C for 90 min and followed by 10 cycles of (50°C for 2 min, 42°C for 2 min), then heat inactivated at 70°C for 15 min. Samples were then amplified with an addition of 14 µl PCR mix made of 1 µl H2O, 0.5 µl ISPCR primer (10 µM), 12.5 µl KAPA HiFi HotStart ReadyMix (KAPA Biosystems, KK2602). The PCR reaction was performed as follows: 98°C for 3 min, 22 cycles of (98°C for 15 s, 67°C for 20 s, 72°C for 6 min), and final extension at 72°C for 5 min.
The amplified cDNA product was purified using VAHTS DNA Clean Beads. Sequencing libraries were prepared using TruePrep DNA Library Prep Kit V2 for Illumina (Vazyme, TD503-02).
Primer sequences: RT primer (Sangon), 5′Biotin-AAGCAGTGGTATCAACGCAGAGTACTTTTTT TTTTTTTTTTTTTTTTTTTTTTTTVN; TSO primer (Sangon), 5′Biotin-AAGCAGTGGTATCAAC CAGAGTACAT/rG//rG//iXNA_G/; ISPCR primer (Sangon), 5′Biotin-AAGCAGTGGTATCAACGC AGA*G*T.
RNA-seq analysis
Raw fastq reads were trimmed by Cutadapt (version 1.18) to trim adapter and low-quality sequence.
Reads were aligned to the mouse genome (mm10) using STAR (version 2.5.3). The number of reads within each gene in each single cell was counted using RSEM (version 1.3.0) with gene annotation file from GENCODE (GRCm38.m23).
Differential expression was estimated by using DESeq2 package (version 1.26) with absolute log2 Fold change >0.5 and adjusted p-value <0.05.
Functional enrichment analysis was performed by using the clusterProfiler R package (v3.14.3) with default parameters (p-value <0.05) and the functional annotations terms in Gene Ontology (GO) (Ashburner et al., 2000).
ATAC-sequencing
ATAC-seq were performed using TruePrep DNA Library Prep Kit V2 for Illumina according to the manufacturer’s recommendation. Briefly, live cells were sorted using PI staining, then 5 × 10⁴ cells were transferred to a low-binding centrifuge tube and resuspended in 50 μl of pre-chilled Lysis Buffer. After 20 times pipetting, cells were incubated on ice for 10 min for lysis. Subsequently, cells were pelleted by centrifugation at 4°C 500 × g for 5 min, and suspended in a mixture consisting of 10 μl of 5× TTBL, 5 μl of TTE Mix V50, and 35 μl of ddH2O. The mixture was gently mixed by pipetting 20 times, and incubated at 37°C for 30 min for fragmentation. The products were purified using 2× VAHTS DNA Clean Beads, eluted with 26 μl of water, and collected for the subsequent amplification. 24 μl of the eluted samples were amplified with different combination of i7 index and i5 index primers. QPCR were performed to determine the cycle number for PCR amplification.0.55× VAHTS DNA Clean Beads was employed for size selection of the PCR product. Finally, 30 ng of each sample were pooled for subsequent second-generation sequencing, on the Illumina NovaSeq 6000 with read length of 150 bp.
ATAC-seq analysis
Raw fastq reads were trimmed by Cutadapt (version 1.18) to trim adapter and low-quality sequence.
Reads were aligned to the mouse genome (mm10) using Bowtie2 (version 2.3.3.1), the parameters are -t -q -N 1 -L 25 -X 2000 --no-mixed --no-discordant.
Reads with alignment quality <Q30, mapped to chrM, overlapping with ENCODE blacklisted regions were discarded. Duplicates were removed using Picard (version 2.20.4) and Samtools (version 1.13). Open chromatin region peaks were called on using MACS2 peak caller (version 2.2.7.1) with the following parameters: -nomodel -nolambda -call-summits. Peaks from all samples were merged and peaks falls in ENCODE blacklisted regions were filtered out.
Differential peaks were estimated by using ‘edgeR’ method in the R package DiffBind (version 2.14.0) with absolute log2 Fold change >1 and adjusted p-value <0.05.
The peaks annotations were performed with the ‘annotatePeak’ function in the R package ChIPseeker (Yu et al., 2015).
The plot of ATAC-seq signals over a set of genomic regions were calculated by using ‘computeMatrix’ function in deepTools (version 2.0) and plotted by using ‘plotHeatmap’ and ‘plotProfile’ functions in deepTools.
Cut&Tag assay
Foxp3-RFP+iTreg were induced, and infected with NFAT-Flag-GFP lentiviruses on days 1.5 and 2.5 of induction. On day 5, Foxp3-RFP+MSCV-NFAT-Flag-GFP+iTregs were sorted, then rested and restimulated for 2 days. Cut&Tag assay was performed using Hyperactive Universal CUT&Tag Assay Kit for Illumina (Vazyme Biotech Co., Ltd) according to the manufacturer’s recommendation. Briefly, 1 × 10⁵ iTregs were collected to low-binding centrifuge tubes and washed. Nucleus isolation were performed by NE buffer for 10 min on ice, and crosslinked by 0.1% formaldehyde for 2 min, then stopped by glycine. Con A Beads were pre-treated with binding buffer, and then incubated with nuclei of iTreg for 10 min. Further, samples were incubated with anti-Flag M2 antibody (1:50) or without primary antibody (Mock) overnight at 4°C. Goat Anti-Mouse IgG secondary antibody (1:50) was added and incubated for 1 hr. Cells were washed three times, and then incubated with pA/G-Tnp enzyme for 1 hr. After incubation, samples were mixed with 5× TTBL and Dig-300 Buffer and incubated at 37°C for 60 min for fragmentation. DNA was extracted and purified, then amplified with different combination of i7 index and i5 index primers. QPCR was performed to determine the cycle number for PCR amplification.VAHTS DNA Clean Beads were employed for size selection of the PCR product. Finally, 30 ng of each sample were pooled for subsequent second-generation sequencing, on the Illumina NovaSeq 6000 with read length of 150 bp.
Cut&Tag data analysis
Raw fastq reads were trimmed by Cutadapt (version 1.18) to trim adapter and low-quality sequence.
Reads were aligned to the mouse genome (mm10) using Bowtie2 (version 2.3.3.1), the parameters are -t -q -N 1 -L 25 -X 2000 --no-mixed --no-discordant.
Reads with alignment quality <Q30, mapped to chrM, overlapping with ENCODE blacklisted regions (https://sites.google.com/site/anshulkundaje/projects/blacklists) were discarded. Duplicates were removed using Picard (version 2.20.4) and Samtools (version 1.13). Open chromatin region peaks were called using MACS2 peak caller (version 2.2.7.1) with the following parameters: -nomodel -nolambda -call-summits. Peaks from all samples were merged and peaks falls in ENCODE blacklisted regions were filtered out.
The peaks annotations were performed with the ‘annotatePeak’ function in the R package ChIPseeker (Yu et al., 2015).
The plot of Cut&Tag signals over a set of genomic regions were calculated by using ‘computeMatrix’ function in deepTools and plotted by using ‘plotHeatmap’ and ‘plotProfile’ functions in deepTools.
The motif enrichment analysis was performed by using the ‘findMotifsGenome.pl’ command in HOMER with default parameters.
The motif occurrences in each peak were identified by using FIMO (MEME suite v5.0.4) with the following settings: a first-order Markov background model, a p-value cutoff of 10−4, and PWMs (Position weight matrix) from the mouse HOCOMOCO motif database (v11).
Statistical analysis
Calculation and graphing were done with Prism (GraphPad). Data were presented as mean ± standard error of the mean, unless indicated otherwise. Student’s t-test was used for comparing endpoint means of different groups. p-value <0.05 was considered significant. *p < 0.05; **p < 0.01; ***p < 0.001; ****p < 0.0001; N.S., not significant. Numbers of independently performed experiment repeats are shown as N, biological replicates of each experiment as n.
Appendix 1
Appendix 1—key resources table
| Reagent type (species) or resource | Designation | Source or reference | Identifiers | Additional information |
|---|---|---|---|---|
| Strain, strain background (Mus musculus) | C57BL6/J | Jackson Laboratory | Strain #:000664 from Jackson Laboratory | |
| Strain, strain background (Mus musculus) | Foxp3-GFP (B6.Cg-Foxp3tm2Tch/J) | Hai Qi of School of Medicine, Tsinghua University | Strain #:006772 from Jackson Laboratory | |
| Strain, strain background (Mus musculus) | Foxp3-RFP | Zhou Xuyu of Institute of Microbiology, Chinese Academy of Sciences | Foxp3-RFP | |
| Strain, strain background (Mus musculus) | CD45.1 | Jackson Laboratory | Strain #:002014 from Jackson Laboratory | |
| Strain, strain background (Mus musculus) | OT-II | Hai Qi of School of Medicine, Tsinghua University | Strain #:004194 from Jackson Laboratory | |
| Antibody | Ultra-LEAF Purified anti-mouse CD3ε Antibody, Armenian Hamster monoclonal | Biolegend | 100340 | 0.5 μg/ml |
| Antibody | Ultra-LEAF Purified anti-mouse CD28 Antibody, Syrian Hamster monoclonal | Biolegend | 102116 | 1 μg/ml |
| Antibody | NFATc1 Antibody (7A6), mouse monoclonal | Santa Cruz | sc-7294 | 1:2000 |
| Antibody | NFATc2 Antibody (4G6-G5), mouse monoclonal | Santa Cruz | sc-7296 | 1:2000 |
| Antibody | Lamin A/C (4C11) Mouse mAb | CST | 4777 | 1:2000 |
| Antibody | β-Actin (13E5) Rabbit mAb | CST | 4970 | 1:1000 |
| Antibody | GAPDH (D4C6R) Mouse mAb | CST | 97166 | 1:1000 |
| Antibody | Monoclonal ANTI-FLAG M2 antibody produced in mouse | Sigma | F1804 | 1:50 |
| Antibody | Goat Anti-Mouse IgG Secondary Antibody, monoclonal | Sino Biological | SSA021 | 1:50 |
| Antibody | Histone H3 (D2B12) XP Rabbit mAb (ChIP Formulated) | CST | 4620 | 1:50 |
| Antibody | Anti-Histone H3 (tri methyl K4) antibody - ChIP Grade, Rabbit polyclonal | Abcam | ab8580 | 1:50 |
| Antibody | Goat Anti-Rabbit IgG Secondary Antibody, monoclonal | Sino Biological | SSA018 | 1:50 |
| Antibody | Biotin anti-mouse CD3ε Antibody, Armenian Hamster monoclonal | Biolegend | 100303 | 0.5 μg/ml |
| Antibody | FOXP3 Monoclonal Antibody (150D/E4), PE, mouse monoclonal | eBioscience | 12-4774-42 | 1:500 |
| Antibody | FOXP3 Monoclonal Antibody (150D/E4), Alexa Fluor 488, mouse monoclonal | eBioscience | 53-4774-41 | 1:500 |
| Antibody | CD4 Monoclonal Antibody (GK1.5), APC, rat monoclonal | eBioscience | 17-0041-82 | 1:500 |
| Antibody | CD25 Monoclonal Antibody (PC61.5), PE, rat monoclonal | eBioscience | 12-0251-82 | 1:500 |
| Antibody | CD44 Monoclonal Antibody (IM7), APC, rat monoclonal | eBioscience | 17-0441-83 | 1:500 |
| Antibody | PE anti-mouse CD62L, rat monoclonal | Biolegend | 104408 | 1:500 |
| Peptide, recombinant protein | Recombinant Human TGF-beta 1 Protein | R&D | 240-B-010 | |
| Peptide, recombinant protein | Recombinant Human IL-2 | R&D | 202-IL | |
| Peptide, recombinant protein | Purified Streptavidin | Biolegend | 405150 | |
| Commercial assay, kit | LIVE/DEAD Fixable Aqua Dead Cell Stain Kit, for 405 nm excitation | Invitrogen | L34965 | |
| Commercial assay, kit | Propidium Iodide | Beyotime | C1062M-3 | |
| Commercial assay, kit | Mouse CD4+ T Cell Isolation Kit | Stem cell | 19852 | |
| Commercial assay, kit | Mouse CD25 Treg Cell positive selection Kit | Stem cell | 18782 | |
| Commercial assay, kit | Foxp3/Transcription Factor Staining Buffer Set | eBioscience | 00-5523-00 | |
| Commercial assay, kit | NE-PER Nuclear and Cytoplasmic Extraction Reagents | Thermo | 78835 | |
| Commercial assay, kit | TruePrep DNA Library Prep Kit V2 for Illumina | Vazyme | TD501 | |
| Commercial assay, kit | Hyperactive Universal CUT&Tag Assay Kit for Illumina | Vazyme | TD903 | |
| Commercial assay, kit | TruePrep Index Kit V2 for Illumina | Vazyme | TD202 | |
| Commercial assay, kit | VAHTS DNA Clean Beads | Vazyme | N411 | |
| Commercial assay, kit | Mouse IL-21 Uncoated ELISA | Invitrogen | 88–8210 | |
| Chemical compound, drug | Cyclosporin A | MCE | HY-B0579 | |
| Chemical compound, drug | CM-4620 | MCE | HY-101942 | |
| Chemical compound, drug | Thapsigargin | Invitrogen | T7459 | |
| Chemical compound, drug | Ionomycin | beyotime | S1672 | |
| Chemical compound, drug | Caffeine | Aladdin | C106953 | |
| Chemical compound, drug | 4-CMC | Sigma | C55402 | |
| Chemical compound, drug | Fluo-4, AM, cell permeant | Thermo | F14201 | |
| Chemical compound, drug | Cal RedTM R525/650 AM | AAT Bioquest | 20591 | |
| Chemical compound, drug | Indo-1 AM | BD | 565879 | |
| Chemical compound, drug | Pluronic F-127 | Sigma | P2443 | |
| Chemical compound, drug | CellTak 1 MG WI, 1/CS | BD | 354240 | |
| Chemical compound, drug | Hanks’ Solution | Coolaber | SL6080 | |
| Chemical compound, drug | HBSS, 10× (without Calcium) | Macgene | CC016 | |
| Chemical compound, drug | Imject Alum | Thermo | 77161 | |
| Chemical compound, drug | OVA Peptide (323-339) | GenScript | RP10610-1 | |
| Chemical compound, drug | OVA | Sigma | A5503 | |
| Chemical compound, drug | Cell Trace CFSE | Thermo | C34554 | |
| Chemical compound, drug | Retinoic Acid | Sigma | R2625 | |
| Chemical compound, drug | InSolution Rapamycin | Sigma | 553211 | |
| Chemical compound, drug | L-Ascorbic acid (Vitamin C) | Sigma | A4403 | |
| Chemical compound, drug | AS2863619 | MCE | HY-126675A | |
| Chemical compound, drug | BAY 11-7082 | MCE | HY-13453 | |
| Chemical compound, drug | SP600125 | MCE | HY-12041 | |
| Chemical compound, drug | T-5224 | MCE | HY-12270 | |
| Software, algorithm | FlowJo | FlowJo LLC | ||
| Software, algorithm | Prism | GraphPad | ||
| Software, algorithm | IGV | Broad Institute | ||
| Software, algorithm | Imaris | Andor | ||
| Software, algorithm | R | R studio | ||
| Software, algorithm | JPK Data Processing | JPK |
Data availability
RNA/ATAC/CUT&TAG associated sequencing data have been deposited in GEO under accession code GSE246431. All data excepted from the sequencing data, generated or analyzed during this study are included in the Source Data files.
-
NCBI Gene Expression OmnibusID GSE246431. Sustained store-operated calcium entry utilizing activated chromatin state leads to instability in iTregs.
References
-
In vivo instruction of suppressor commitment in naive T cellsThe Journal of Experimental Medicine 199:1401–1408.https://doi.org/10.1084/jem.20040249
-
Gene Ontology: tool for the unification of biologyNature Genetics 25:25–29.https://doi.org/10.1038/75556
-
Conversion of peripheral CD4+CD25- naive T cells to CD4+CD25+ regulatory T cells by TGF-beta induction of transcription factor Foxp3The Journal of Experimental Medicine 198:1875–1886.https://doi.org/10.1084/jem.20030152
-
IL-2 Controls the Stability of Foxp3 Expression in TGF-β–Induced Foxp3+ T Cells In VivoThe Journal of Immunology 186:6329–6337.https://doi.org/10.4049/jimmunol.1100061
-
Strong adhesion by regulatory T cells induces dendritic cell cytoskeletal polarization and contact-dependent lethargyThe Journal of Experimental Medicine 214:327–338.https://doi.org/10.1084/jem.20160620
-
The functional contribution of calcium ion flux heterogeneity in T cellsImmunology and Cell Biology 93:694–704.https://doi.org/10.1038/icb.2015.34
-
CD25- T cells generate CD25+Foxp3+ regulatory T cells by peripheral expansionJournal of Immunology (Baltimore, Md 173:7259–7268.https://doi.org/10.4049/jimmunol.173.12.7259
-
Developmental regulation of Foxp3 expression during ontogenyThe Journal of Experimental Medicine 202:901–906.https://doi.org/10.1084/jem.20050784
-
TGF-beta induces Foxp3 + T-regulatory cells from CD4 + CD25 - precursorsAmerican Journal of Transplantation 4:1614–1627.https://doi.org/10.1111/j.1600-6143.2004.00566.x
-
Ca2+ signaling in T-lymphocytesCritical Reviews in Immunology 18:419–448.https://doi.org/10.1615/critrevimmunol.v18.i5.20
-
Alloantigen-specific de novo-induced Foxp3+ Treg revert in vivo and do not protect from experimental GVHDEuropean Journal of Immunology 39:3091–3096.https://doi.org/10.1002/eji.200939432
-
Orai1 subunit stoichiometry of the mammalian CRAC channel pore: CRAC channel subunit stoichiometryThe Journal of Physiology 586:419–425.https://doi.org/10.1113/jphysiol.2007.147249
-
Sumoylation of the transcription factor NFATc1 leads to its subnuclear relocalization and interleukin-2 repression by histone deacetylaseThe Journal of Biological Chemistry 284:10935–10946.https://doi.org/10.1074/jbc.M900465200
-
Full-length RNA-seq from single cells using Smart-seq2Nature Protocols 9:171–181.https://doi.org/10.1038/nprot.2014.006
-
Regulatory T cells and Foxp3Immunological Reviews 241:260–268.https://doi.org/10.1111/j.1600-065X.2011.01018.x
-
A kinetic and dynamic analysis of Foxp3 induced in T cells by TGF-betaJournal of Immunology 179:7667.https://doi.org/10.4049/jimmunol.178.12.7667
-
NFATc1 autoregulation: a crucial step for cell-fate determinationTrends in Immunology 27:461–469.https://doi.org/10.1016/j.it.2006.08.005
-
tTregs, pTregs, and iTregs: similarities and differencesImmunological Reviews 259:88–102.https://doi.org/10.1111/imr.12160
-
Regulation of the NFAT pathway discriminates CD4+CD25+ regulatory T cells from CD4+CD25- helper T cellsJournal of Leukocyte Biology 83:708–717.https://doi.org/10.1189/jlb.0507321
-
NFAT functions as a working memory of Ca2+ signals in decoding Ca2+ oscillationThe EMBO Journal 22:3825–3832.https://doi.org/10.1093/emboj/cdg381
-
Smad3 and NFAT cooperate to induce Foxp3 expression through its enhancerNature Immunology 9:194–202.https://doi.org/10.1038/ni1549
-
Kinetics and extent of T cell activation as measured with the calcium signalThe Journal of Experimental Medicine 185:1815–1825.https://doi.org/10.1084/jem.185.10.1815
-
Control of Foxp3 stability through modulation of TET activityThe Journal of Experimental Medicine 213:377–397.https://doi.org/10.1084/jem.20151438
-
Induced regulatory T cells promote tolerance when stabilized by rapamycin and IL-2 In VivoThe Journal of Immunology 191:5291–5303.https://doi.org/10.4049/jimmunol.1301181
-
Regulation of the murine Nfatc1 gene by NFATc2The Journal of Biological Chemistry 277:10704–10711.https://doi.org/10.1074/jbc.M107068200
Peer review
Reviewer #1 (Public Review):
This study revealed that one of the mechanisms for iTreg (induced-Treg) lineage instability upon restimulation is through sustained store-operated calcium entry (SOCE), which activates transcription factor NFAT and promotes changes in chromatin accessibility to activated T cell-related genes. The authors revealed that, unlike thymus-derived Tregs (tTreg) with blunted calcium signaling and NFAT activation, iTregs respond to TCR restimulation with fully activated SOCE and NFAT similar to activated conventional T cells. Activated NFAT binds to open chromatin regions in genes related to T helper cells, increases their expression, and leads to the instability of iTreg cells. On the other hand, inhibition of the SOCE/NFAT pathway by chemical inhibitors could partially rescue the loss of Foxp3 expression in iTreg upon restimulation. The conclusion of the study is unexpected since previous studies showed that NFAT is required for Foxp3 induction and iTreg differentiation (Tone Y et al, Nat Immunol. 2008, PMID: 18157133; Vaeth M et al, PNAS, 2012, PMID: 22991461). Additionally, Foxp3 interacts with NFAT to control Treg function (Wu Y et al, Cell, 2006, PMID: 16873067). The data presented in this study demonstrated the complex role NFAT plays in the generation and stability of iTreg cells.
Several concerns are raised from the current study.
1. Previous studies showed that iTregs generated in vitro from culturing naïve T cells with TGF-b are intrinsically unstable, and prone to losing Foxp3 expression due to lack of DNA demethylation in the enhancer region of the Foxp3 locus (Polansky JK et al, Eur J Immunol., 2008, PMID: 18493985). It is known that removing TGF-b from the culture media leads to rapid loss of Foxp3 expression. In the current study, TGF-b was not added to the media during iTreg restimulation, therefore, the primary cause for iTreg instability should be the lack of the positive signal provided by TGF-b. NFAT signal is secondary at best in this culturing condition.
This point has been addressed in the revision. Figure Q1 could be added to the manuscript as a supplementary figure.
2. It is not clear whether the NFAT pathway is unique in accelerating the loss of Foxp3 expression upon iTreg restimulation. It is also possible that enhancing T cell activation in general could promote iTreg instability. The authors could explore blocking T cell activation by inhibiting other critical pathways, such as NF-kb and c-Jun/c-Fos, to see if a similar effect could be achieved compared to CsA treatment.
This point has been sufficiently addressed in the revision.
3. The authors linked chromatin accessibility and increased expression of T helper cell genes to the loss of Foxp3 expression and iTreg instability. However, it is not clear how the former can lead to the latter. It is also not clear whether NFAT binds directly to the Foxp3 locus in the restimulated iTregs and inhibits Foxp3 expression.
This point has been addressed in the rebuttal. Could the authors incorporate their comments in the rebuttal into the discussion section of the revised manuscript?
https://doi.org/10.7554/eLife.88874.3.sa1Reviewer #2 (Public Review):
The phenotypic instability of in vitro-induced Treg cells (iTregs) has been discussed for a long time, mainly in the context of the epigenetic landscape of Treg-signature genes; e.g. Treg-specifically CpG-hypomethylated Foxp3 CNS2 enhancer region. However, it has been insufficiently understood the upstream molecular mechanisms, the particularity of intracellular signaling of natural Treg cells, and how they connect to stable/unstable suppressive function.
Huiyun Lv et al. addressed the issue of phenotypic instability of in vitro-induced regulatory T cells (iTregs), which is a different point from the physiological natural Treg cells and an obstacle to the therapeutic use of iTreg cells. The authors focused on the difference between iTreg and nTreg cells from the perspective of their control of store-operated calcium entry (SOCE)-mediated cellular signaling, and they clearly showed that the sustained SOCE signaling in iTreg and nTreg cells led to phenotypic instability. Moreover, the authors pointed out the correlation between the incomplete conversion of chromatin configuration and the NFAT-mediated control of effector-type gene expression profile in iTreg cells. These findings potentially cultivate our understanding of the cellular identity of regulatory T cells and may shed light on the therapeutic use of Treg cells in many clinical contexts.
The authors demonstrated the biological contribution of Ca2+ signaling with the variable methods, which ensure the reliability of the results and the claims of the authors. iTreg cells sustained SOCE-signaling upon stimulation while natural Treg cells had lower strength and shorter duration of SOCE-signaling. The result was consistent with the previously proposed concept; a certain range of optimal strength and duration of TCR-signaling shape the Treg generation and maintenance, and it provides us with further in-depth mechanistic understanding.
In the later section, authors found the incomplete installment of Treg-type open chromatin landscape in some effector/helper function-related gene loci in iTreg cells. These findings propose the significance of focusing on not only the "Treg"-associated gene loci but also "Teffector-ness"-associated regions to determine the Treg conversion at the epigenetic level.
Limitations;
・NFAT regulation did not explain all of the differences between iTregs and nTregs, as the authors mentioned as a limitation.
・Also, it is still an open question whether NFAT can directly modulate the chromatin configuration on the effector-type gene loci, or whether NFAT exploits pre-existing open chromatin due to the incomplete conversion of Treg-type chromatin landscape in iTreg cells. The authors did not fully demonstrate that the distinct pattern of chromatin regional accessibility found in iTreg cells is the direct cause of an effector-type gene expression.
https://doi.org/10.7554/eLife.88874.3.sa2Author response
The following is the authors’ response to the original reviews.
Reviewer #1 (Public Review):
Several concerns are raised from the current study.
(1) Previous studies showed that iTregs generated in vitro from culturing naïve T cells with TGF-b are intrinsically unstable and prone to losing Foxp3 expression due to lack of DNA demethylation in the enhancer region of the Foxp3 locus (Polansky JK et al, Eur J Immunol., 2008, PMID: 18493985). It is known that removing TGF-b from the culture media leads to rapid loss of Foxp3 expression. In the current study, TGF-b was not added to the media during iTreg restimulation, therefore, the primary cause for iTreg instability should be the lack of the positive signal provided by TGF-b. NFAT signal is secondary at best in this culturing condition.
In restimulation, void of TGFb is necessary to cause iTreg instability. Otherwise, the setup is similar to the iTreg-inducing environment (Author response image 1). On the other hand, the ultimate goal of this study is to provide a scenario that bears some resemblance of clinical treatment, where TGFb may not be available. The reviewer is correct in stating that TGFb is essential for iTreg stability, we are studying the role played by NFAT in iTreg instability in vitro, and possibly in potential clinical use of iTreg .
Author response image 1
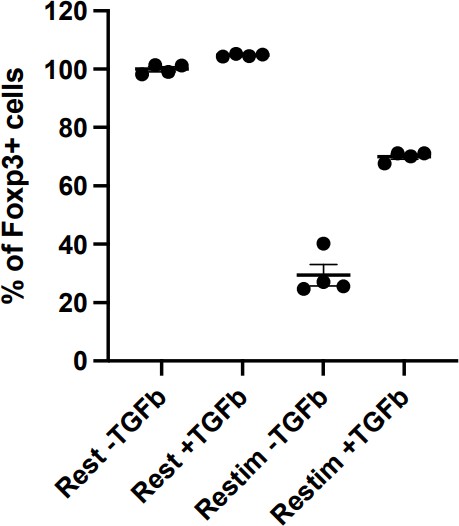
Restimulation with TGFb will persist iTreg inducing environment, resulting in less pronounced instability.
Sorted Foxp3-GFP+ iTregs were rested for 1d, and then rested or restimulated in the presence of TGF-β for 2 d. Percentages of Foxp3+ cells were analyzed by intracellular staining of Foxp3 after 2 d.
(2) It is not clear whether the NFAT pathway is unique in accelerating the loss of Foxp3 expression upon iTreg restimulation. It is also possible that enhancing T cell activation in general could promote iTreg instability. The authors could explore blocking T cell activation by inhibiting other critical pathways, such as NF-kb and c-Jun/c-Fos, to see if a similar effect could be achieved compared to CsA treatment.
We thank the reviewer for this suggestion. We performed this experiment according to see extent of the role that NFAT plays, or whether other major pathways are involved. As Author response image 2 shows, solely inhibiting NFAT effectively rescued the instability of iTreg. The inhibition of NFkB (BAY 11-7082), c-Jun (SP600125), or a c-Jun/c-Fos complex (T5224) had no discernable effect, or in one case, possibly further reduction in stability.These results may indicate that NFAT plays a crucial and special role in TCR activation, which leads to iTreg instability. Other pathways, as far as how this experiment is designed, do not appear to be significantly involved.
Author response image 2
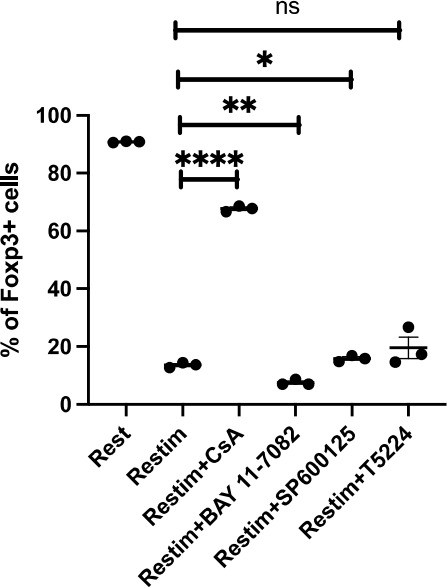
Comparing effects of NFAT, NF-kB and c-Jun/c-Fos inhibitors on iTreg instability.
Sorted Foxp3-GFP+ iTregs were rested for 1d, then restimulated by anti-CD3 and CD28 in the presence of listed inhibitors. Percentages of Foxp3+ cells were analyzed by intracellular staining after 2d restimulation.
(3) The authors linked chromatin accessibility and increased expression of T helper cell genes to the loss of Foxp3 expression and iTreg instability. However, it is not clear how the former can lead to the latter. It is also not clear whether NFAT binds directly to the Foxp3 locus in the restimulated iTregs and inhibits Foxp3 expression.
T helper gene activation is likely to cause instability in iTregs by secreting more inflammatory cytokines, as shown in Figure Q9, for example, IL-21 secretion. Further investigation is needed to understand how these genes contribute to Foxp3 gene instability exactly. With our limited insight, there may be two possibilities. 1. IL-21 directly affects Foxp3 through its impact on certain inflammation-related transcription factors (TFs). 2. There could be an indirect relationship where NFAT has a greater tendency to bind to those inflammatory TFs when iTreg instability appears, promoting the upregulation of these Th genes like in activated T cells, while being less likely to bind to SMAD and Foxp3, representing a competitive behavior. We at the moment cannot comprehend the intricacies that lead to the differential effects on T helper genes and Treg related genes.
With that said, we have previously attempted to explore the direct effect of NFAT on Foxp3 gene locus. Foxp3 transcription in iTregs primarily relies on histone modifications such as H3K4me3 (Tone et al., 2008; Lu et al., 2011) rather than DNA demethylation (Ohkura et al., 2012; Hilbrands et al., 2016). Previous studies have reported that NFAT and SMAD3 can together promote the histone acetylation of Foxp3 genes (Tone et al., 2008). In our previous set of experiments, we simultaneously obtained information of NFAT binding sites and H3K4me3. In Foxp3 locus, we observed a decreasing trend in NFAT binding to the CNS3 region of Foxp3 in restimulated iTregs compared to resting iTregs (Author response image 3). Additionally, the H3K4me3 modification in the CNS3 region of Foxp3 decreased upon iTreg restimulation, but inhibiting NFAT nuclear translocation with CsA could maintain this modification at its original level (Author response image 3).
Author response image 3
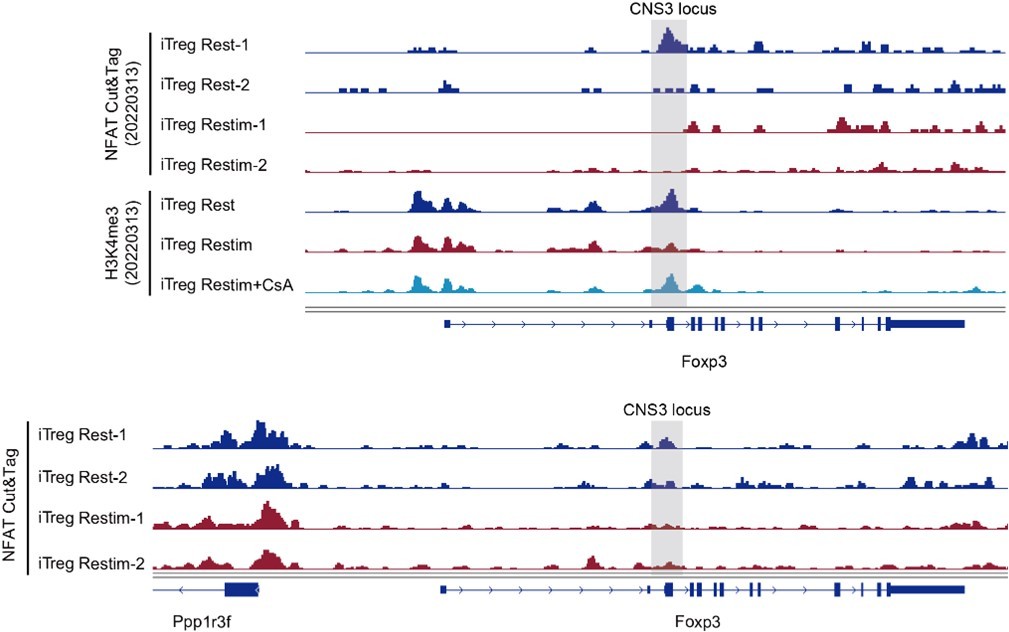
The NFAT binding and histone modification on Foxp3 gene locus.
Genome track visualization of NFAT binding profiles and H3K4me3 profiles in Foxp3 CNS3 locus in two batches of dataset.
Based on these preliminary explorations, it is concluded that NFAT can directly bind to the Foxp3 locus, and it appears that NFAT decreases upon restimulation, resulting in a decrease in H3K4me3, ultimately leading to the close association of NFAT and Foxp3 instability. However, due to limited sample replicates, these data need to be verified for more solid conclusions. We speculate that during the induction of iTregs, NFAT may recruit histone-modifying enzymes to open the Foxp3 CNS3 region, and this effect is synergistic with SMAD. When instability occurs upon restimulation, NFAT binding to Foxp3 weakens due to the absence of SMAD's assistance, subsequently reducing the recruitment of histone modifications enzyme and ultimately inhibiting Foxp3 transcription.
Reviewer #2 (Public Review):
(1) Some concerns about data processing and statistic analysis.
The authors did not provide sufficient information on statistical data analysis; e.g. lack of detailed descriptions about
-the precise numbers of technical/biological replicates of each experiment
-the method of how the authors analyze data of multiple comparisons... Student t-test alone is generally insufficient to compare multiple groups; e.g. figure 1.
These inappropriate data handlings are ruining the evidence level of the precious findings.
We thank the reviewer for pointing out this important aspect. In the figure legend, numbers of independently-performed experiment repeats are shown as N, biological replicates of each experiment as n.Student’s t test was used for comparing statistical significance between two groups. In this manuscript, all calculations of significant differences were based on comparisons between two groups. There were no multiple conditions compared simultaneously within a single group, and thus, no other calculation methods were used.
(2) Untransparent data production; e.g. the method of Motif enrichment analysis was not provided.Thus, we should wait for the author's correction to fully evaluate the significance and reliability of the present study.
Per this reviewer’s request, we have provided detailed descriptions of the data analysis for Fig 5, including both the method section and the Figure legend, as presented below:
“The peaks annotations were performed with the “annotatePeak” function in the R package ChIPseeker (Yu et al, 2015).
The plot of Cut&Tag signals over a set of genomic regions were calculated by using “computeMatrix” function in deepTools and plotted by using “plotHeatmap” and “plotProfile” functions in deepTools.The motif enrichment analysis was performed by using the "findMotifsGenome.pl" command in HOMER with default parameters.
The motif occurrences in each peak were identified by using FIMO (MEME suite v5.0.4) with the following settings: a first-order Markov background model, a P value cutoff of 10-4, and PWMs from the mouse HOCOMOCO motif database (v11).”
Additionally, we have also supplemented the method section with further details on the analysis of RNA-seq and ATAC-seq data.
(3) Lack of evidence in human cells. I wonder whether human PBMC-derived iTreg cells are similarly regulated.
This is a rather complicated issue, human T cells express FoxP3 upon TCR stimulation (PNAS, 103(17): 6659–6664), whose function is likely to protect T cells from activation induced cell death, and does not offer Treg like properties. In contrast in mice, FoxP3 can be used as an indicator of Treg. Currently, this is not a definitive marker for Treg in human, our FoxP3 based readouts do not apply. Nevertheless, we have now investigated whether inhibiting calcium signaling or NFAT could enhance the stability of human iTreg. As shown in Author response image 4, we found that the proportion of Foxp3-expressing cells did not show significant changes across the different conditions, while the MFI analysis revealed that CsA-treated iTreg exhibited higher Foxp3 expression levels compared to both restimulated iTreg and rest iTreg. However, CM4620 had no significant effect on Foxp3 stability, consistent with the observation of its limited efficacy in suppressing human iTreg long term activation. In summary, our results suggest that inhibiting NFAT signaling through CsA treatment can help maintain higher levels of Foxp3 expression in human iTreg.
Author response image 4
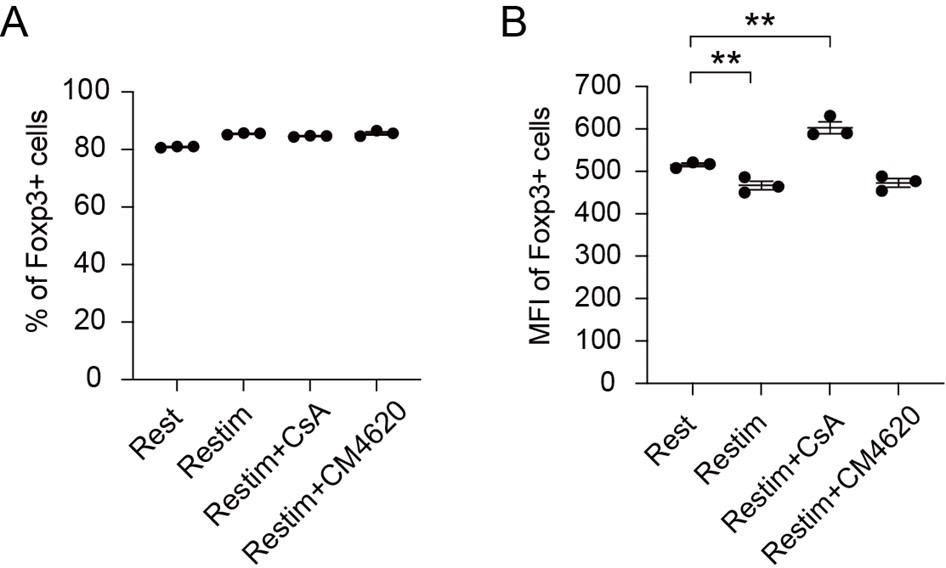
Effect of inhibiting NFAT and calcium on human iTreg stability.
Human naïve CD4 cells from PBMC were subjected to a two-week induction process to generate human iTreg. Subsequently, human iTreg were restimulated for 2 days with dynabeads followed by 2 days of rest in the prescence of CsA and CM-4620. Four days later, percentages of Foxp3+ cells and Foxp3 mean fluorescence intensity (MFI) were analyzed by intracellular staining.
(4) NFAT regulation did not explain all of the differences between iTregs and nTregs, as the authors mentioned as a limitation. Also, it is still an open question whether NFAT can directly modulate the chromatin configuration on the effector-type gene loci, or whether NFAT exploits pre-existing open chromatin due to the incomplete conversion of Treg-type chromatin landscape in iTreg cells. The authors did not fully demonstrate that the distinct pattern of chromatin regional accessibility found in iTreg cells is the direct cause of an effector-type gene expression.
To our surprise, the inhibition of NFkB (BAY 11-7082), c-Jun (SP600125), and the c-Jun/c-Fos complex (T5224) resulted in minimal alterations, as shown in Fig Q1. This seems to argue that NFAT may play a more special role in events leading iTreg instability.
We hypothesize that NFAT takes advantage of pre-existing open chromatin state due to the incomplete conversion of chromatin landscape in iTreg cells. Because iTreg cells, after induction, already exhibit inherent chromatin instability, with highly-open inflammatory genes. Furthermore, when iTreg cells were restimulated, the subsequent change in chromatin accessibility was relatively limited and not rescued by NFAT inhibitor treatment (Author response image 5). Therefore, in the case of iTreg cells, we propose that NFAT exploits the easy access of those inflammatory genes, leading to rapid destabilization of iTreg cells in the short term.
In contrast, tTreg cells possess a relatively stable chromatin structure in the beginning, it would be interesting to investigate whether NFAT or calcium signaling could disrupt chromatin accessibility during the activation or expansion of tTreg cells. It is possible that NFAT might cause the loss of the originally established demethylation map and open up inflammatory loci, thereby inducing a shift in gene transcriptional profiles, equally leading to instability.
Author response image 5
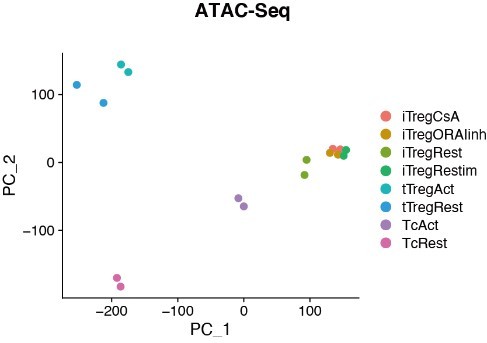
Chromatin accessibility of Rest, Retimulated, CsA/ORAIinh treated restimulated iTreg.
PCA visualization of chromatin accessibility profiles of different cell types. Color indicates cell type.
To establish a direct relationship between gene locus accessibility and its overexpression, a controlled experimental approach can be employed. One such method involves precise manipulation of the accessibility of a specific genomic locus using CRISPR-mediated epigenetic modifications at targeted loci. Subsequently, the impact of this manipulation on the expression level of the target gene can be precisely examined. By conducting these experiments, it will be possible to determine whether the augmented gene accessibility directly causes the observed gene overexpression.
Reviewer #1 (Recommendations For The Authors):
It might be helpful to add TGF-b to the iTreg restimulation culture to remove the influence of the lack of TGF-b from the equation, and measure the influence of SOCE/NFAT on iTreg instability.
Please refer to Author response image 1.
Alternatively, authors can also culture iTreg cells with TGF-b for 2 weeks when they undergo epigenetic changes and become more stabilized (Polansky JK et al, Eur J Immunol., 2008, PMID: 18493985). At this point, the stabilized iTregs can be used to measure the influence of SOCE/NFAT on iTreg instability.
In the study conducted by Polansky, it was observed in Figure 1 that prolonged exposure to TGF-β fails to induce stable Foxp3 expression and demethylation of the Treg-specific demethylated region (TSDR). Based on this finding, we could consider exploring alternative approaches to obtain a more stabilized iTreg population. One such approach could be isolating Foxp3+helios-Nrp1- iTreg cells directly from the peripheral in vivo, which are also known as pTregs. Generally, pTreg cells generated in vivo tend to be more stable compared to iTreg cells induced in vitro, and they already exhibit partial demethylation of the Treg signature, as shown in Fig 6C (Polansky JK et al, Eur J Immunol., 2008, PMID: 18493985). Investigating the role of NFAT and calcium signaling in pTreg cells would provide further insights into the additional roles of NFAT in Treg phenotypical transitions, particularly its role in chromatin accessibility.
In Figure 3, NFAT binding to the inflammatory genes in iTreg cells was even stronger than in activated T conventional cells. This is possibly due to Tconv cells being stimulated only once while iTregs were restimulated. A fair comparison should be conducted with restimulated activated conventional T cells.
Figure 3 demonstrates the accessibility of inflammatory gene loci, rather than NFAT binding. Comparing restimulated Tconvs with restimulated iTreg cells is indeed a valuable suggestion, as their activation state and polarization in iTreg directions could lead to distinct chromatin accessibility. Although one is activated long term regularly and the other is activated long term under iTreg polarization, it is highly likely that the chromatin state of both activated Tconvs and iTreg cells is highly open, especially in terms of the accessibility of inflammatory genes. This may provide us with a new perspective to understand iTreg cells, but will unlikely affect our central conclusion.
In the in vivo experiment in Figure 6, a control condition without OVA immunization should be included as a baseline.
We have performed this experiment in the absence of OVA, as depicted in Author response image 6. In the absence of OVA immunization, both WT-ORAI and DN-ORAI iTreg exhibited substantial stability, although DN-ORAI demonstrated a slightly less stable trend. Upon activation with 40ug and 100ug of OVA, DN-ORAI iTreg demonstrated enhanced stability than WT-ORAI iTreg, maintaining a higher proportion of Foxp3 expression.
Author response image 6
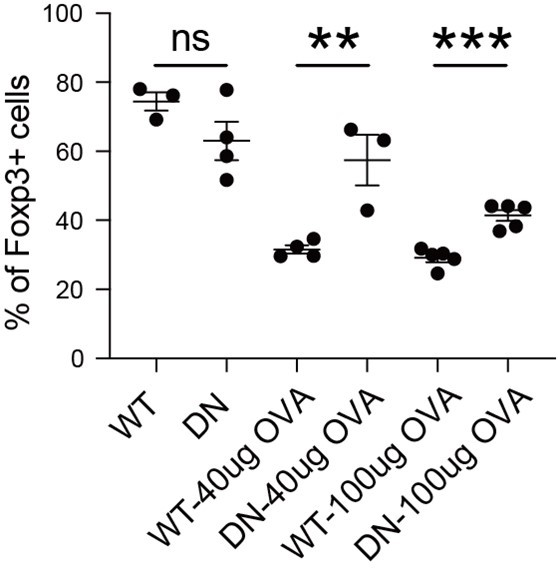
Stability of DN-ORAI iTreg in vivo with or without OVA immunization.
WT-ORAI/DN-ORAI-GFP+-transfected CD45.2+ Foxp3-RFP+ OT-II iTregs were transferred i.v. into CD45.1 mice. Recipients were left or immunized with OVA323-339 in Alum adjuvant. On day 5, mLN were harvested and analyzed for Foxp3 expression by intracellular staining.
Reviewer #2 (Recommendations For The Authors):
Major
Some concerns about the data processing and statistic analysis, as mentioned in the public review.In the figure legend, what does it mean e.g. n=3, N=3? Technical triplicate experiments? Three mice? Independently-performed three experiments? The authors should define it at least in the "Statistical analysis" in the method section otherwise the readers cannot determine the reason why they mainly use SEM for the data description.
Moreover, in some cases, the number of experiments was not sure; e.g., Fig.1B, Fig. 5.
How did the authors analyze data including multiple comparisons? Student t-test alone is generally insufficient to compare multiple groups; e.g. figure 1.
We thank the reviewer for pointing out this omission. Now, in the figure legend, numbers of independently-performed experiment repeats are shown as N, biological replicates of each experiment as n.For Fig. 1B, N=2, and for Fig 5, we have acquired NFAT Cut&Tag data for 2 times, N=2.Student’s t test was used for comparing statistical significance between two groups. In this manuscript, all calculations of significant differences were based on comparisons between two groups. There were no multiple conditions compared simultaneously within a single group, and thus, no other calculation methods were involved apart from the Student's t-test.
In Figure 1A, the difference in suppressiveness seemed subtle. Data collection of multiple doses of Tconv:Treg ratio will enhance the reliability of such kind of analysis.
We have now attempted the suppression assay with varying Treg:Tconv ratios and observed that the suppressive effect of iTreg was more obvious than that of tTreg when co-cultured at a 1:1 ratio with Tconv cells. However, as the cell number of tTreg and iTreg decreased, the inhibitory effects converged.
Author response image 7
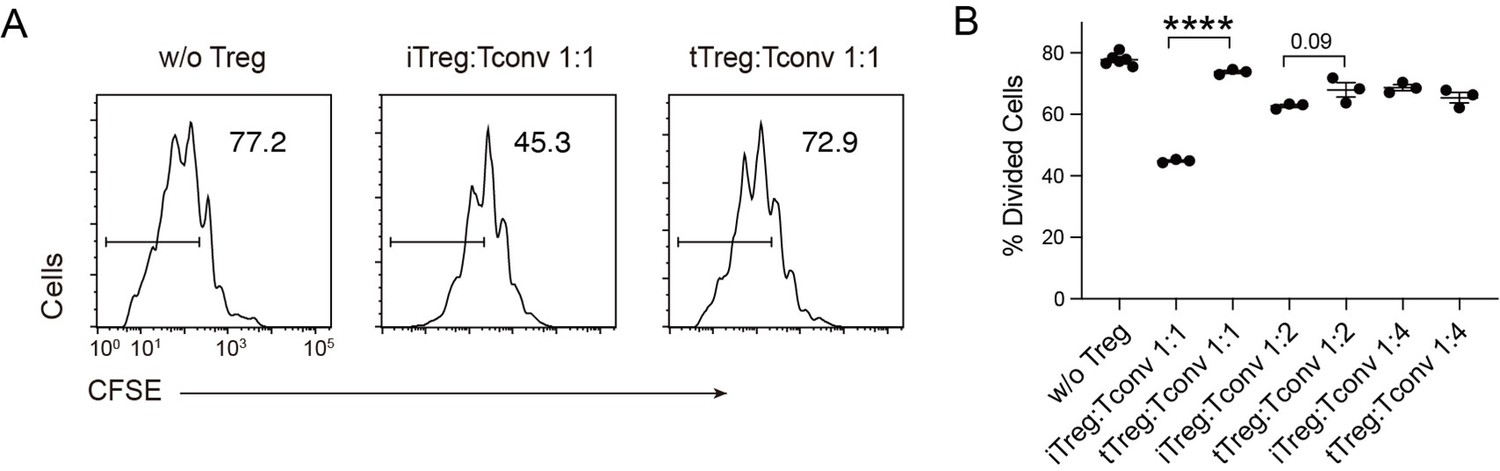
Compare multiple dose of Tconv:Treg ratio in suppression functionCFSE-labelled OT-II T cells were stimulated with OVA-pulsed DC, then different number of Foxp3-GFP+ iTregs and tTregs were added to the culture to suppress the OT-II proliferation.
After 4 days, CFSE dilution were analyzed. Left, Representative histograms of CFSE in divided Tconvs. Right, graph for the percentage of divided Tconvs.
In Figure 3F, to which group did the shaded peaks belong? In this context, the authors should focus on "Activation Region" peaks (open chromatin signature in both TcAct & iTreg defined in Fig. 4D) but I did not find the peak in the focusing DNA regions in TcAct (e.g. the shaded regions in IL-4 loci). The clear attribution of the peaks to the heatmap will enhance the visibility and understanding of readers.
We have selected some typical peaks that belong to Fig 3D. These genes encompass some T-cell activation-associated transcription factors, such as Irf4, Atf3, as well as multiple members of the Tnf family including Lta, Tnfsf4, Tnfsf8, and Tnfsf14. Additionally, genes related to inflammation such as Il12rb2, Il9, and Gzmc are included. These genes show elevated accessibility upon T-cell activation, partially open in activated nTreg cells, referred to as the "Activation Region." They collectively exhibit high accessibility in iTreg cells, which may contribute to their instability.
Author response image 8
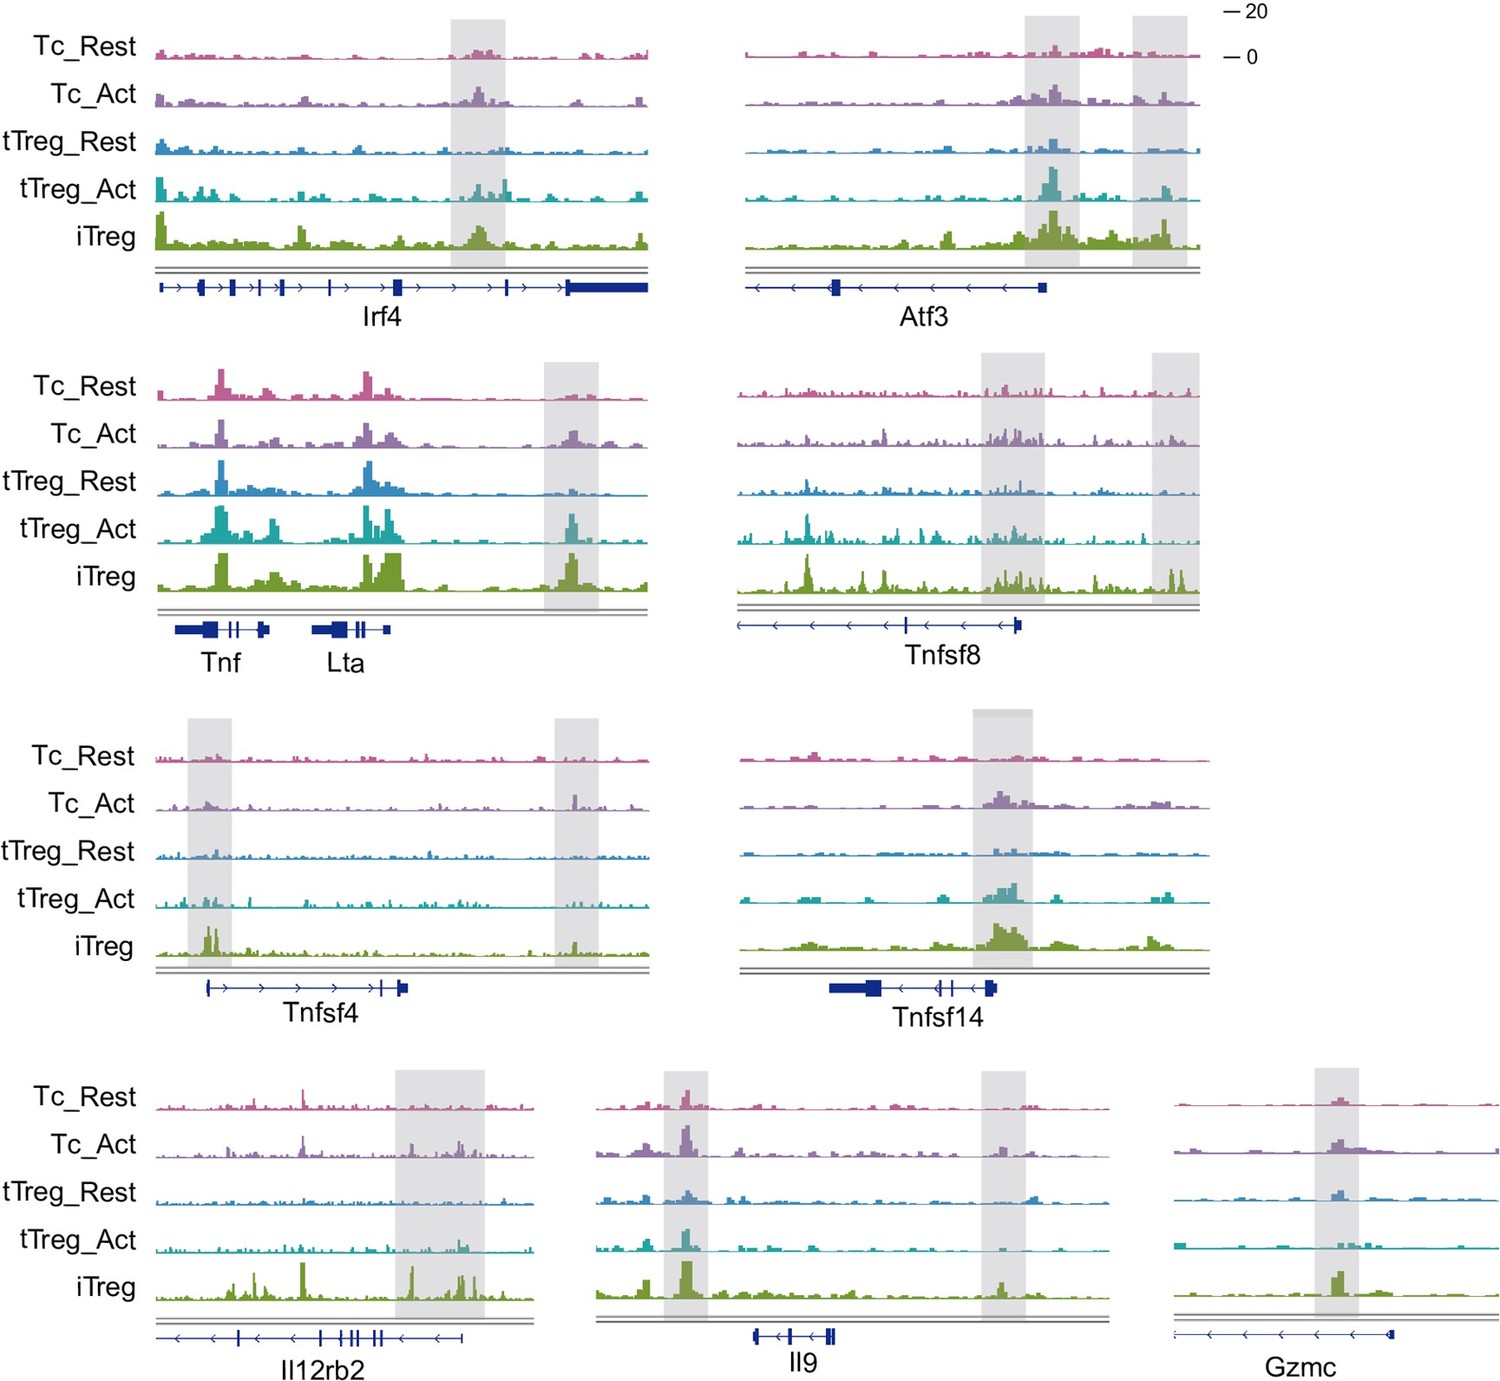
Chromatin accessibility of some “Activation Region”.
Genomic track showing chromatin accessibility of Irf4, Atf3, Lta, Tnfsf8, Tnfsf4, Tnsfsf14, Il12rb2, Il9, Gzmc in activated Tconv and iTreg.
In Figure 4A/S4A, the information on cell death will help the understanding of readers because the sustained SOCE is associated with cell survival as shown in Fig. S2. The authors can discuss the relationships between cell death and Foxp3 retention, which potentially leads to a further interesting question; e.g. the selective/resistance to activation-induced cell death as the identity of Treg cells.
As shown in Author response image 9, activated iTreg cells indeed exhibit a certain degree of cell death compared to resting iTreg cells. The inhibition of NFAT by CsA enhances the survival rate of iTreg cells, but the inhibition of ORAI by CM-4620 leads to more severe cell death. The cell death induced by CsA and CM-4620 is not consistent, indicating that there may not be a direct proportional relationship between cell death and the expression of Foxp3 and Treg identity.
Author response image 9
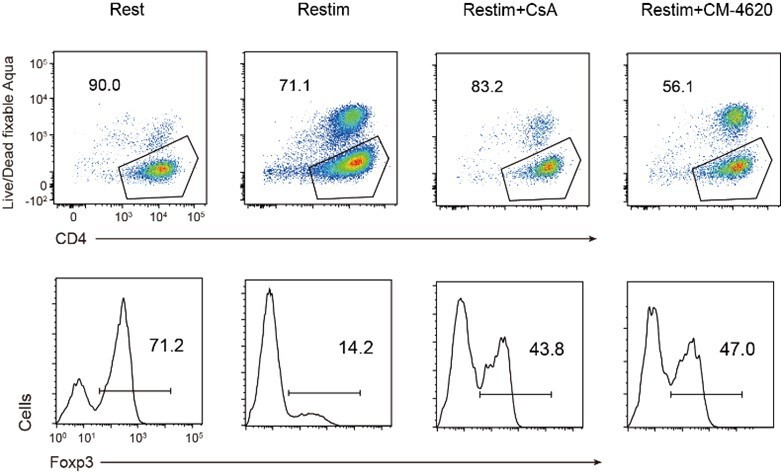
Relationship of cell death and Foxp3 stability in restimulated iTregs.
Sorted Foxp3-GFP+ iTregs were rested for 1d, then restimulated by anti-CD3 and CD28 in the presence of CsA or CM-4620. After 2d restimulation, live cell percentage were analyzed by staining of Live/Dead fixable Aqua, and percentages of Foxp3+ cells were analyzed by intracellular staining of Foxp3. Upper, live cell percentage of iTregs. Lower, percentages of Foxp3 in iTregs.
In Figure 5, the information for the data interpretation was insufficient.
We have provided detailed descriptions of the data analysis for Fig 5, including both the method section and the Figure legend, as presented below:
“The peaks annotations were performed with the “annotatePeak” function in the R package ChIPseeker (Yu et al, 2015).The plot of Cut&Tag signals over a set of genomic regions were calculated by using “computeMatrix” function in deepTools and plotted by using “plotHeatmap” and “plotProfile” functions in deepTools.The motif enrichment analysis was performed by using the "findMotifsGenome.pl" command in HOMER with default parameters.The motif occurrences in each peak were identified by using FIMO (MEME suite v5.0.4) with the following settings: a first-order Markov background model, a P value cutoff of 10-4, and PWMs from the mouse HOCOMOCO motif database (v11).”
Additionally, we have also supplemented the method section with further details on the analysis of RNA-seq and ATAC-seq data.
The correlation between the open chromatin status of the gene loci described in Fig.5E and the expression at mRNA level? e.g.; Do iTreg-Act cells produce a higher level of IL-21 than nTreg-act?The analysis in Fig.5F-G should be performed in parallel with nTreg cells to emphasize the distinct NFAT-chromatin regulation in iTreg cells.
We have now compared the secretion levels of IL-21 in tTreg and iTreg upon activation and treated with CsA by ELISA. As shown in Author response image 10, tTreg did not secrete IL-21 regardless of activation status (undetectable), while iTreg did not secrete IL-21 at resting state but exhibited IL-21 secretion after 48 h of activation. Moreover, the secretion of IL-21 was inhibited by CsA and CM-4620 treatment. This observation aligns with our earlier findings where we observed nuclear binding of NFAT to gene loci of these cytokines, enhancing their expression and pushing iTreg unstable under inflammatory conditions. These findings further underscore the likelihood that the inhibition of calcium and NFAT signaling might contribute to the stabilization of iTreg by suppressing the secretion of inflammatory cytokines.
Author response image 10
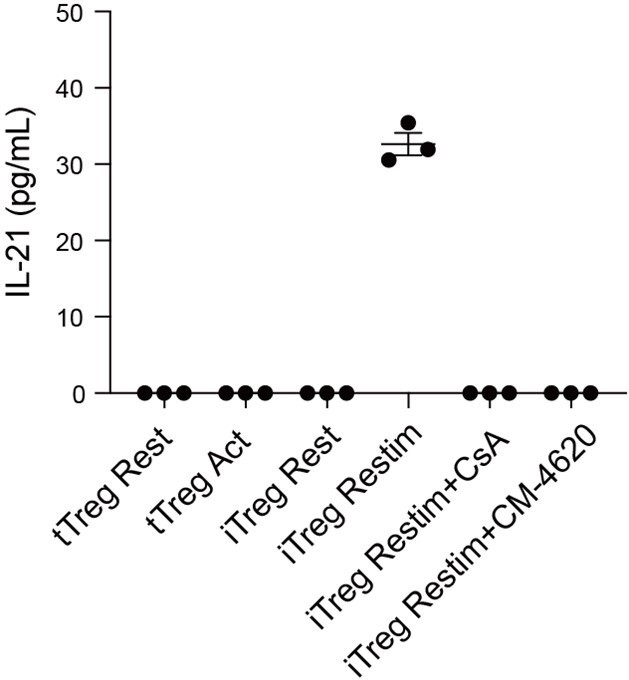
IL-21 secretion in tTreg and iTreg upon activation.
iTregs and tTregs were sorted and restimulated with anti-CD3 and anti-CD28 antibodies, in the presence of CsA and CM-4620. Cell culture supernatant were harvested after 2 d restimulation and IL-21 secretion was analyzed by ELISA.
Performing a parallel comparison of NFAT activity between tTreg and iTreg cells was initially part of our experimental plan. However, it proved challenging in practice, as we encountered difficulties in efficiently infecting tTreg cells with NFAT-flag. Consequently, we could not obtain a sufficient number of tTreg cells for conducting Cut&Tag experiments.
Based on our observations, we speculate that there might be substantial differences in the accessibility of genes in tTreg cells, leading to considerable variations in the repertoire of genes available for NFAT to regulate. As a result, we expect significant differences in the nuclear localization and activity of NFAT between iTreg and tTreg cells.
In Figure 6C, what does the FCM plot between Foxp3-CFSE look like?
The authors can discuss the mechanism of ORAI-DN-mediated through such analysis; e.g. the possibility that selective proliferation defect by ORAI-DN in Foxp3- cells led to an increased percentage of Foxp3, not only just unstable transcription of Foxp3.
This is an in vitro experiment to assess the suppressive effect of iTreg on Tconv proliferation. Therefore, CFSE is used to stain Tconv cells, but not iTreg cells, so we did not detect proliferation feature of iTreg.
Minor
Confusing terminology of "tTreg" at line 47, etc. "natural Treg" contains both thymic-derived Treg and periphery-derived Treg cells. (A Abbas et al. Nat Immunol. 2013)
We have now changed the designation to tTreg at line 47. tTreg refers to thymus-derived regulatory T cells, while nTreg includes both tTreg and pTreg. However, it is important to note that the Treg cells used in our study were isolated from the spleen of 2-4-month-old Foxp3-GFP or Foxp3-RFP mice. The CD4+ T cells were first enriched using the CD4 Isolation kit, and the FACSAriaII was utilized to collect CD4+ Foxp3-GFP/RFP+ Treg cells. Subsequently, Helios and Nrp-1 staining revealed that the majority of these cells were nTreg, with only approximately 6% being pTreg. Overall, we consider the cells we used as tTreg.
In all FCM analyses, the authors should clarify how to detect Foxp3 expression; Foxp3-GFP/Foxp3-RFP/Intracellular staining like Figure S5A (but not specified in the other FCM plots)
All Foxp3 expressions in the article were assessed using intracellular staining, as described in the methods section, and we have added specific descriptions to each figure legend. The reason for employing intracellular staining is that we used Foxp3-IRES-GFP mice, where GFP and Foxp3 are not fused into a single protein, existing as separate proteins after expression. Therefore, during induction, the appearance of GFP protein might potentially represent the presence of Foxp3. However, in cases of Foxp3 instability, the degradation of GFP protein may not be entirely synchronized with that of Foxp3 protein, making GFP an unreliable indicator of Foxp3 expression levels. As a result, for the purification of pure iTreg cells, we used Foxp3-GFP/RFP fluorescence, while for observing instability, we employed intranuclear staining of Foxp3.
In Figure 6B, the captions were lacking in the two graphs on the right side
The two restimulation conditions, 0.125+0.25 and 0.25+0.5, have been added into Fig 6B right side.
In Figure S2, the annotation of the x-y axis was missing.
Added.
Lack of reference at line 292.
Reference 42-46 were added.
In the method section, the authors should note the further product information of antibodies and reagents to enhance reproducibility and transparency. Making a list that clarifies the suppliers, Ab clone, product IDs, etc. is encouraged. The authors did not specify the supplier of recombinant proteins and which type of TGF-beta (TGF-beta 1, 2, or 3?).
A detailed description of the mice, antibodies, Peptide recombinant protein, commercial kit, and software has been provided and incorporated into the methods section.
In the method section, the authors should clarify which Foxp3-reporter strain. There are many strains of Foxp3-reporter mice in the world. In line 373, is the "FoxP3-IRES-GFP transgenic mice" true? Knock-in strain or BAC-transgene?
This mouse is a gift from Hai Qi Lab in Tsinghua University. They acquired this mouse strain from Jackson Laboratory, and the strain name is B6.Cg-Foxp3tm2Tch/J, Strain #:006772. An IRES-EGFP-SV40 poly A sequence was inserted immediately downstream of the endogenous Foxp3 translational stop codon, but upstream of the endogenous polyA signal, generating a bicistronic locus encoding both Foxp3 and EGFP.
The age of mice used in the experiments should be specified, and confusing words such as "young" should not be used in any method descriptions; e.g. line 405.
The detailed mouse age has been added in the methods section. “To prepare Tconv, tTreg and iTreg for experiments, spleen was isolated from 2-4-month-old Foxp3-GFP mice for Tconv and tTreg sorting, and 6-week-old mice for iTreg induction.”
The method of how the original ATAC-seq/Cut & Tag data were generated was not described in the method section.
Added in method section.
The reference section was incomplete, and the style was not unified. e.g.; ref 7, 24, 25, 26 ... I gave up checking all.
The style of ref 7, 22, 24, 26, 28, 31, 33, 35 were modified.
Changes in manuscript:
Author Name: “Huiyun Lv” to “Huiyun Lyu”.
Fig 1A was updated according to Reviwer 2’s suggestion.
Fig S3E and associated description was added according to Reviwer 2’s suggestion.
Fig S4C and associated description was added according to Reviwer 1’s suggestion.
Fig 5H and associated description was added according to Reviwer 2’s suggestion.
Fig 6D were updated according to Reviwer 1’s suggestion.
Fig 2D was corrected, the labels for gapdh and actin in the iTreg panel were inadvertently switched. The mistakehas been rectified, and the original gel image will be provided.
Fig 2A and Fig 4A was updated.
The style of Fig 6B and Fig S2A was modified.
Method:
Mice: FoxP3-IRES-GFP with more description.
Flow Cytometry sorting and FACS: the detailed mouse age has been added.RNA-seq analysis, ATAC-sequencing, ATAC-seq analysis, Cut&Tag assay, Cut&Tag data analysis: more description was added.
Statistical analysis: “Numbers of independently-performed experiment repeats are shown as N, biological replicates of each experiment as n.” were added.
Reference: Ref 42-46 and 49-52 were added. The style of ref 7, 22, 24, 26, 28, 31, 33, 35 were corrected.
A detailed description of the mice, antibodies, Peptide recombinant protein, commercial kit, and software has been provided.
https://doi.org/10.7554/eLife.88874.3.sa3Article and author information
Author details
Funding
National Natural Science Foundation of China (31370878)
- Yan Shi
National Natural Science Foundation of China (31630023)
- Yan Shi
National Natural Science Foundation of China (81621002)
- Yan Shi
Canadian Institutes of Health Research (PJT-166155)
- Yan Shi
Canadian Institutes of Health Research (PJT-156334)
- Yan Shi
Natural Sciences and Engineering Research Council of Canada (RGPIN/03748-2018)
- Yan Shi
The funders had no role in study design, data collection, and interpretation, or the decision to submit the work for publication.
Acknowledgements
We thank Dr. Hai Qi for providing Foxp3-GFP mice, platE cell line and guidance of calcium-related experimental design. We thank Dr. Saiyong Zhu for providing TetO-FUW-flag-Nfatc1 plasmid. We also thank Imaging Core Facility, Technology Center for Protein Sciences of Tsinghua University for assistance. Y.S. is supported by the joint Peking-Tsinghua Center for Life Sciences, the National Natural Science Foundation of China General Program (31370878), State Key Program (31630023), and Innovative Research Group Program (81621002), CIHR (PJT-156334 and PJT-166155) and NSERC (RGPIN/03748-2018).
Ethics
This study was performed in strict accordance with the recommendations in the Guide for the Care and Use of Laboratory Animals of the National Institutes of Health. All of the animals were handled according to approved Institutional Animal Care and Use Committee (IACUC) protocols of the Tsinghua University. The protocol was approved by the Committee on the Ethics of Animal Experiments of the Tsinghua University (22-SY6). All surgery was performed under sodium pentobarbital anesthesia, and every effort was made to minimize suffering.
Senior Editor
- Tadatsugu Taniguchi, University of Tokyo, Japan
Reviewing Editor
- Shimon Sakaguchi, Osaka University, Japan
Version history
- Sent for peer review: May 5, 2023
- Preprint posted: June 6, 2023 (view preprint)
- Preprint posted: July 4, 2023 (view preprint)
- Preprint posted: November 3, 2023 (view preprint)
- Version of Record published: December 6, 2023 (version 1)
Cite all versions
You can cite all versions using the DOI https://doi.org/10.7554/eLife.88874. This DOI represents all versions, and will always resolve to the latest one.
Copyright
© 2023, Lyu, Yuan et al.
This article is distributed under the terms of the Creative Commons Attribution License, which permits unrestricted use and redistribution provided that the original author and source are credited.
Metrics
-
- 67
- Page views
-
- 22
- Downloads
-
- 0
- Citations
Article citation count generated by polling the highest count across the following sources: Crossref, PubMed Central, Scopus.
Download links
A two-part list of links to download the article, or parts of the article, in various formats.
Downloads (link to download the article as PDF)
Open citations (links to open the citations from this article in various online reference manager services)
Cite this article (links to download the citations from this article in formats compatible with various reference manager tools)
Sustained store-operated calcium entry utilizing activated chromatin state leads to instability in iTregs
eLife 12:RP88874.
https://doi.org/10.7554/eLife.88874.3
Further reading
-
- Genetics and Genomics
- Microbiology and Infectious Disease
Plasmids enable the dissemination of antimicrobial resistance (AMR) in common Enterobacterales pathogens, representing a major public health challenge. However, the extent of plasmid sharing and evolution between Enterobacterales causing human infections and other niches remains unclear, including the emergence of resistance plasmids. Dense, unselected sampling is essential to developing our understanding of plasmid epidemiology and designing appropriate interventions to limit the emergence and dissemination of plasmid-associated AMR. We established a geographically and temporally restricted collection of human bloodstream infection (BSI)-associated, livestock-associated (cattle, pig, poultry, and sheep faeces, farm soils) and wastewater treatment work (WwTW)-associated (influent, effluent, waterways upstream/downstream of effluent outlets) Enterobacterales. Isolates were collected between 2008 and 2020 from sites <60 km apart in Oxfordshire, UK. Pangenome analysis of plasmid clusters revealed shared ‘backbones’, with phylogenies suggesting an intertwined ecology where well-conserved plasmid backbones carry diverse accessory functions, including AMR genes. Many plasmid ‘backbones’ were seen across species and niches, raising the possibility that plasmid movement between these followed by rapid accessory gene change could be relatively common. Overall, the signature of identical plasmid sharing is likely to be a highly transient one, implying that plasmid movement might be occurring at greater rates than previously estimated, raising a challenge for future genomic One Health studies.
-
- Evolutionary Biology
- Genetics and Genomics
Microbial plankton play a central role in marine biogeochemical cycles, but the timing in which abundant lineages diversified into ocean environments remains unclear. Here, we reconstructed the timeline in which major clades of bacteria and archaea colonized the ocean using a high-resolution benchmarked phylogenetic tree that allows for simultaneous and direct comparison of the ages of multiple divergent lineages. Our findings show that the diversification of the most prevalent marine clades spans throughout a period of 2.2 Ga, with most clades colonizing the ocean during the last 800 million years. The oldest clades – SAR202, SAR324, Ca. Marinimicrobia, and Marine Group II – diversified around the time of the Great Oxidation Event, during which oxygen concentration increased but remained at microaerophilic levels throughout the Mid-Proterozoic, consistent with the prevalence of some clades within these groups in oxygen minimum zones today. We found the diversification of the prevalent heterotrophic marine clades SAR11, SAR116, SAR92, SAR86, and Roseobacter as well as the Marine Group I to occur near to the Neoproterozoic Oxygenation Event (0.8–0.4 Ga). The diversification of these clades is concomitant with an overall increase of oxygen and nutrients in the ocean at this time, as well as the diversification of eukaryotic algae, consistent with the previous hypothesis that the diversification of heterotrophic bacteria is linked to the emergence of large eukaryotic phytoplankton. The youngest clades correspond to the widespread phototrophic clades Prochlorococcus, Synechococcus, and Crocosphaera, whose diversification happened after the Phanerozoic Oxidation Event (0.45–0.4 Ga), in which oxygen concentrations had already reached their modern levels in the atmosphere and the ocean. Our work clarifies the timing at which abundant lineages of bacteria and archaea colonized the ocean, thereby providing key insights into the evolutionary history of lineages that comprise the majority of prokaryotic biomass in the modern ocean.


