A timeline of bacterial and archaeal diversification in the ocean
- Department of Biological Sciences, Virginia Tech, United States
- Center for Emerging, Zoonotic, and Arthropod-borne Pathogens, Virginia Tech, United States
Abstract
Microbial plankton play a central role in marine biogeochemical cycles, but the timing in which abundant lineages diversified into ocean environments remains unclear. Here, we reconstructed the timeline in which major clades of bacteria and archaea colonized the ocean using a high-resolution benchmarked phylogenetic tree that allows for simultaneous and direct comparison of the ages of multiple divergent lineages. Our findings show that the diversification of the most prevalent marine clades spans throughout a period of 2.2 Ga, with most clades colonizing the ocean during the last 800 million years. The oldest clades – SAR202, SAR324, Ca. Marinimicrobia, and Marine Group II – diversified around the time of the Great Oxidation Event, during which oxygen concentration increased but remained at microaerophilic levels throughout the Mid-Proterozoic, consistent with the prevalence of some clades within these groups in oxygen minimum zones today. We found the diversification of the prevalent heterotrophic marine clades SAR11, SAR116, SAR92, SAR86, and Roseobacter as well as the Marine Group I to occur near to the Neoproterozoic Oxygenation Event (0.8–0.4 Ga). The diversification of these clades is concomitant with an overall increase of oxygen and nutrients in the ocean at this time, as well as the diversification of eukaryotic algae, consistent with the previous hypothesis that the diversification of heterotrophic bacteria is linked to the emergence of large eukaryotic phytoplankton. The youngest clades correspond to the widespread phototrophic clades Prochlorococcus, Synechococcus, and Crocosphaera, whose diversification happened after the Phanerozoic Oxidation Event (0.45–0.4 Ga), in which oxygen concentrations had already reached their modern levels in the atmosphere and the ocean. Our work clarifies the timing at which abundant lineages of bacteria and archaea colonized the ocean, thereby providing key insights into the evolutionary history of lineages that comprise the majority of prokaryotic biomass in the modern ocean.
eLife assessment
This important paper addresses the challenging problem of dating the origin of several groups of marine microorganisms. The analyses are solid, with various test of clock models and time calibrations used; however, given the uncertainty of many of the dates used to anchor ancient geological events, further studies are needed to support or refute the hypotheses put forth in this paper. Despite some methodological concerns, this work is a commendable attempt at an extremely difficult problem and will be of broad interest to microbiologists, geologists, and evolutionary biologists.
https://doi.org/10.7554/eLife.88268.3.sa0Introduction
The ocean plays a central role in the fluxes and stability of Earth’s biogeochemistry (Dontsova et al., 2020; Field et al., 1998; Falkowski et al., 1998). Due to their abundance, diversity, and physiological versatility, microbes mediate the vast majority of organic matter transformations that underpin higher trophic levels (Brown et al., 2014; Mason et al., 2009). For example, marine microorganisms regulate a large fraction of the organic carbon pool (Ducklow and Doney, 2013), drive elemental cycling of nutrients like nitrogen (Zehr and Kudela, 2011), and participate in the ocean-atmosphere exchange of climatically important gasses (Vila-Costa et al., 2006). Starting in the 1980s, analysis of small-subunit ribosomal RNA genes began to reveal the identity of dominant clades of bacteria and archaea that were notable for their ubiquity and high abundance, and subsequent analyses highlighted their diverse physiological activities in the ocean (Giovannoni and Stingl, 2005). Phylogenetic studies showed that these clades are broadly distributed across the Tree of Life (ToL) and encompass a wide range of phylogenetic breadths (Giovannoni and Stingl, 2005). Cultivation-based studies and the large-scale generation of genomes from metagenomes have continued to make major progress in examining the genomic diversity and metabolism of these major marine clades, but we still lack a comprehensive understanding of the evolutionary events leading to their origin and diversification in the ocean.
Several independent studies have used molecular phylogenetic methods to date the diversification of some marine microbial lineages, such as the ammonia-oxidizing archaea of the order Nitrososphaerales (Marine Group I [MGI]) (Ren et al., 2019; Yang et al., 2021; Zhang et al., 2021), picocyanobacteria of the genera Synechococcus and Prochlorococcus (Sánchez-Baracaldo, 2015; Sánchez-Baracaldo et al., 2019; Zhang et al., 2021), and marine alphaproteobacterial groups that included the SAR11 and Roseobacter clades (Luo et al., 2013). Differences in the methodological frameworks used in these studies often hinder comparisons between lineages, however, and results for individual clades often conflict (Ren et al., 2019; Sánchez-Baracaldo, 2015; Yang et al., 2021; Zhang et al., 2021). Moreover, it has been difficult to directly compare bacterial and archaeal clades due to the vast evolutionary distances between these domains. For these reasons, it has remained challenging to evaluate the ages of different marine lineages and develop a comprehensive understanding of the timing of microbial diversification events in the ocean and their relationship with major geological events throughout Earth’s history.
To clarify the timing at which major lineages of bacteria and archaea diversified into the ocean, we developed an approach that leverages a multi-domain phylogenetic tree that allows for simultaneous dating of all major marine lineages. This method allows us to directly compare the ages of divergent lineages across the ToL and subsequently reconstruct a timeline in which these groups evolved into the ocean. Moreover, we can also map the acquisition of different protein families onto this phylogeny and thereby infer the genes that were gained by these marine lineages at the time of their emergence. Altogether, our study provides a comprehensive framework that sheds light on watershed events in the history of life on Earth that have given rise to contemporary biodiversity and biogeochemical dynamics in the ocean.
Results and discussion
To begin analyzing the diversification of marine lineages of bacteria and archaea, we constructed a multi-domain phylogenetic tree that allowed us to directly compare the origin of 13 planktonic marine bacterial and archaeal clades that are notable for their abundance and major roles in marine biogeochemical cycles (Figure 1). We based tree reconstruction on a benchmarked set of marker genes that we have previously shown to be congruent for inter-domain phylogenetic reconstruction (Martinez-Gutierrez and Aylward, 2021; details in ‘Materials and methods,’ Supplementary file 2). Our phylogenetic framework included non-marine clades for phylogenetic context, and overall it recapitulates known relationships across the ToL, such as the clear demarcation of the Gracilicutes and Terrabacteria bacterial superphyla and the basal placement of the Thermatogales within Bacteria (Coleman et al., 2021; Martinez-Gutierrez and Aylward, 2021; Figure 1). To gain insight into the geological landscape in which these major marine clades first diversified, we performed a Bayesian relaxed molecular dating analysis on our benchmarked ToL using several calibrated nodes (Figure 1 and Table 1).
Figure 1
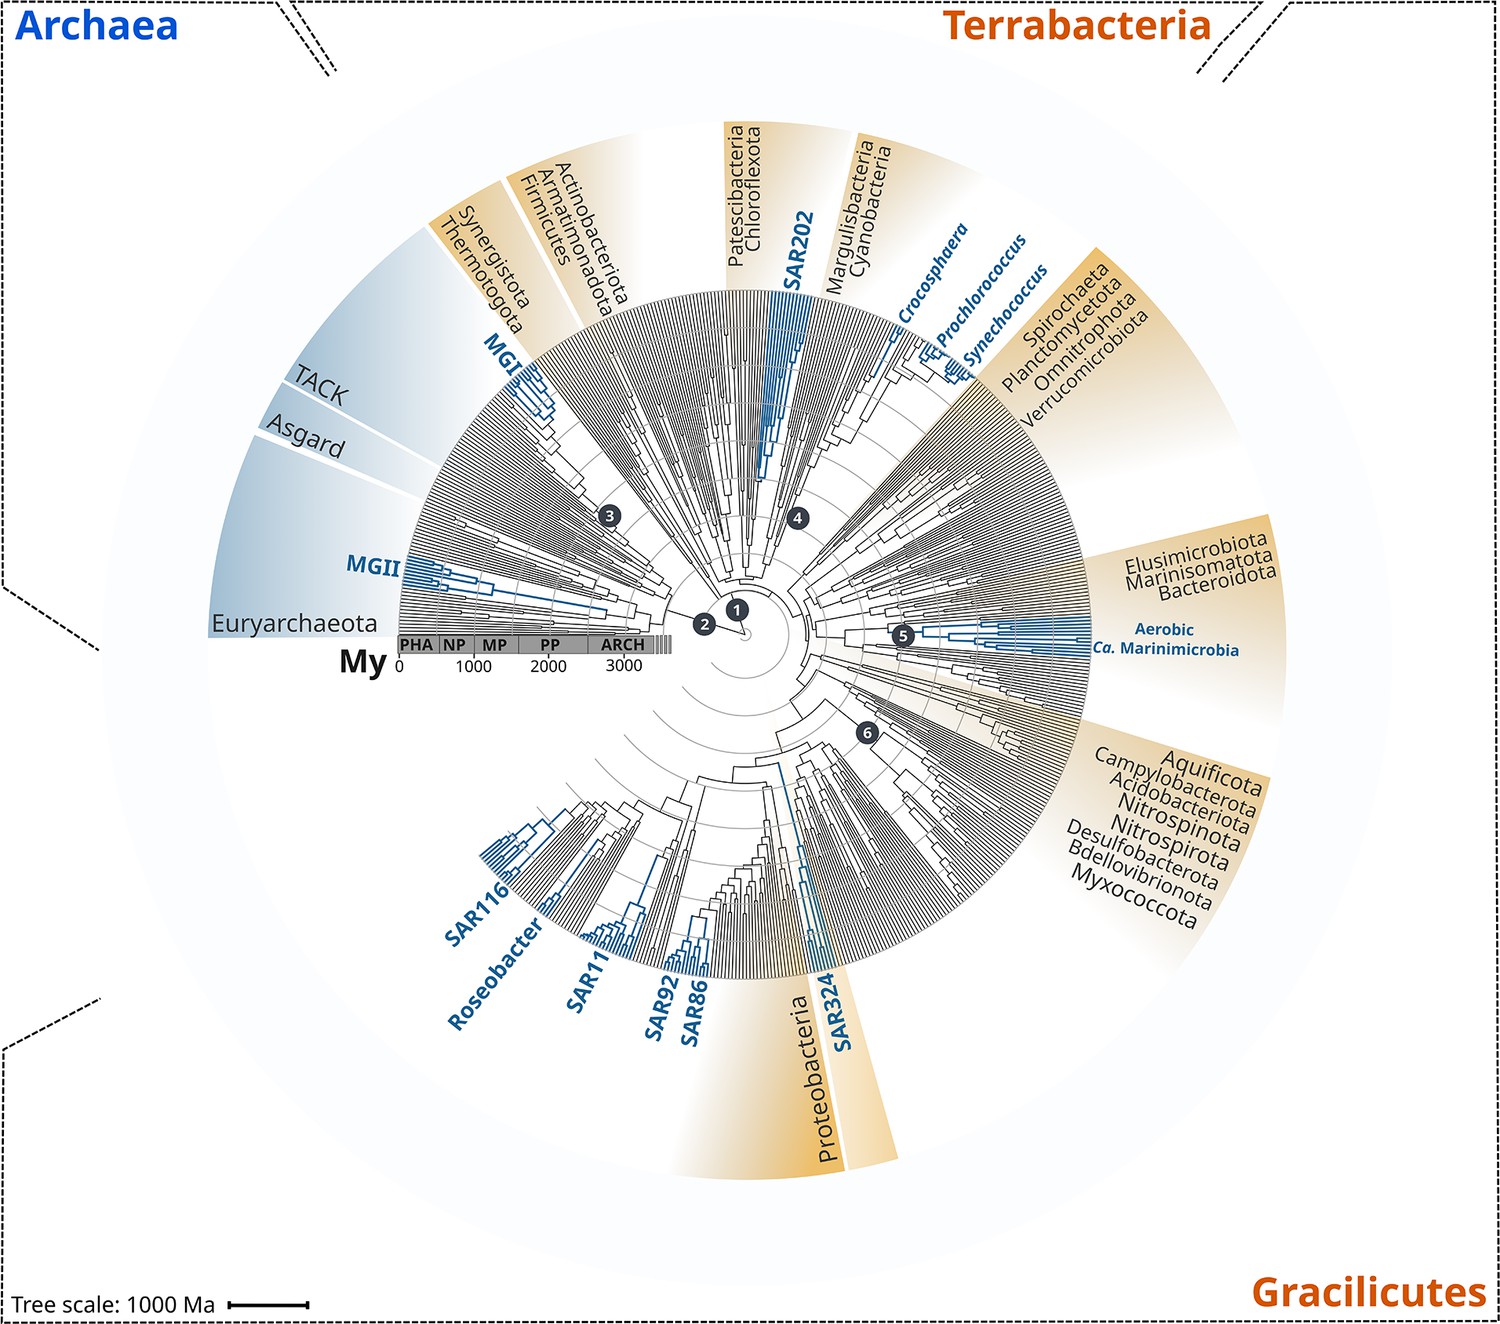
Rooted inter-domain Tree of Life used for molecular dating analyses.
Maximum likelihood tree constructed with IQ-TREE v1.6.12 using the concatenation of 30 RNAP subunits and ribosomal protein sequences and the substitution model LG + R10. Blue labels represent the marine clades dated in our study. Dark gray dots show the temporal calibration used in our molecular dating analyses (Table 1). The marine clades shown are classified on the Genome Taxonomy Database (GTDB) as follows: MGII, Poseidoniales; MGI, Nitrososphaerales; SAR202, SAR202; Crocosphaera, Crocosphaera; Prochlorococcus, Prochlorococcus; Synechococcus, Synechococcus; Ca. Marinimicrobia, Marinisomatia; SAR324, SAR324; SAR86, Oceanospirillales; SAR92, Porticoccaceae; SAR11, Pelagibacterales; Roseobacter, Rhodobacteraceae; SAR116, Puniceispirillaceae. Abbreviations: PHA, Phanerozoic; NP, Neoproterozoic; MP, Mesoproterozoic; PP, Paleoproterozoic; ARCH, Archaean.
Table 1
Temporal calibrations used as priors for the molecular dating of the main marine microbial clades.
See ‘Materials and methods’ for a detailed explanation of the calibrations used.
| Node | Calibration group | Minimum (My) | Maximum (My) | Evidence | Reference |
|---|---|---|---|---|---|
| 1,2 | Bacteria-Archaea Root | - | 4400 | Identification of the most ancient zircons showing evidence of liquid water. | Valley et al., 2014 |
| 1,2 | Bacteria-Archaea Root | 3460 | - | Identification of the most ancient traces of methane. Minimum age for life on Earth. Calibration consistent with the most ancient fossils found to date (~3.5 Ga; Walter et al., 1980). | Ueno et al., 2006 |
| 3 | Aerobic Nitrososphaerales | - | 2320 | Strict aerobic metabolism. | Ueno et al., 2006 |
| 4 | Oxygenic Cyanobacteria | 2320 | - | Oxygenation of the atmosphere. The Great Oxidation Event has been associated with oxygenic Cyanobacteria. | Bekker et al., 2004; Holland, 2006; Holland, 2002 |
| 5 | Aerobic Ca. Marinimicrobia | - | 2320 | Strict aerobic metabolism. | Bekker et al., 2004; Holland, 2006; Holland, 2002 |
| 6 | Nitrite-oxidizing bacteria | - | 2320 | Strict aerobic metabolism. | Bekker et al., 2004; Holland, 2006; Holland, 2002 |
Due to the limited representation of microorganisms in the fossil record and the difficulties to associate fossils to extant relatives, we employed geochemical evidence as temporal calibrations (Figure 1 and Table 1). Moreover, because of the uncertainty in the length of the branch linking bacteria and archaea, the crown node for each domain was calibrated independently. We used both the age of the presence of liquid water (as approximated through the dating of zircons; Valley et al., 2014) as well as the most ancient record of biogenic methane (broadly used as evidence of life on Earth; Ueno et al., 2006) as maximum and minimum prior ages for bacteria and archaea (4400 and 3460 My, respectively, Figure 1 and Table 1). For internal calibration, we used the recent identification of non-oxygenic Cyanobacteria to constrain the diversification node of oxygenic Cyanobacteria with a minimum age of 2320 My, the estimated age for the Great Oxidation Event (GOE) (Bekker et al., 2004; Holland, 2006; Holland, 2002). Similarly, we calibrated the crown node of aerobic ammonia-oxidizing archaea, aerobic Ca. Marinimicrobia, and the nitrite-oxidizing bacteria with a maximum age of 2320 My (GOE estimated age) due to their strict aerobic metabolism. Despite geological evidence pointing to the presence of oxygen before the GOE, our Bayesian estimates indicate an overall consistency of the priors used (Figure 2—figure supplement 2), and we recovered the ancient origin of major bacterial and archaeal supergroups, such as Asgardarchaeota, Euryarchaeota, Firmicutes, Actinobacteria, and Aquificota (Figure 2). Moreover, the date we found for oxygenic Cyanobacteria (2611 My, 95% CI 2589–2632; Figure 2) is in agreement with their diversification happening before the GOE (Ward et al., 2016). Please see Table 1 for a detailed explanation of all calibration dates used, together with our rationale for including each one.
Figure 2 with 3 supplements see all
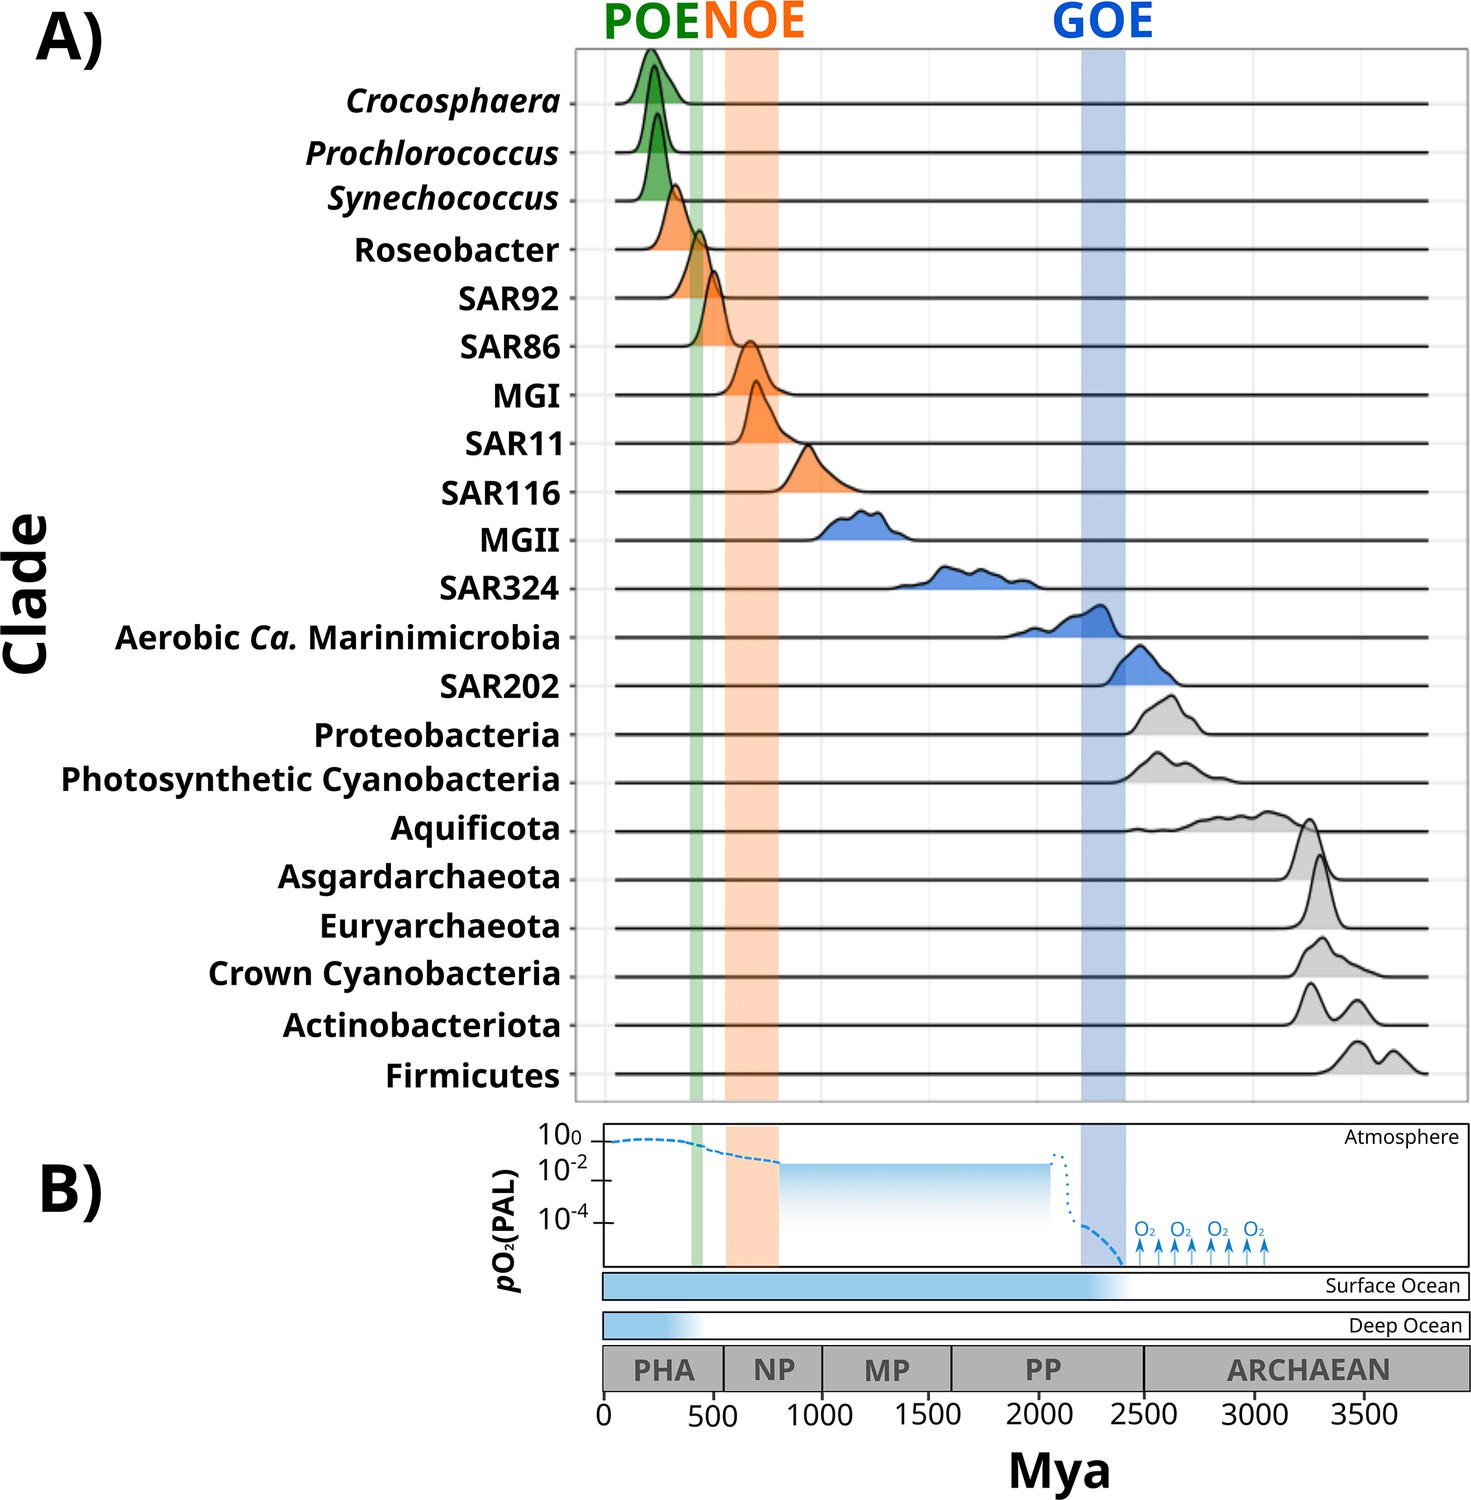
Dates of the diversification of marine microbial clades and the redox history of Earth’s atmosphere, surface ocean, and deep ocean.
(A) Ridges represent the distribution of 100 Bayesian dates estimated using a relaxed molecular clock and an autocorrelated model (see ‘Materials and methods’). Ridges of marine clades were colored based on their diversification date: green, late-branching phototrophs; orange, late-branching clades; blue, early-branching clades. The timing of the diversification of major bacterial and archaeal superphyla is represented with gray ridges. Molecular dating estimates resulting from the uncorrelated model Uncorrelated Gamma Multiplies (UGAM) and the Autocorrelated Model CIR are shown in Figure 2—figure supplement 3. (B) Oxygenation events and redox changes across Earth’s history. Panel adapted from previous work (Figure 1 of Alcott et al., 2019). Abbreviations: POE, Paleozoic Oxidation Event; NOE, Neoproterozoic Oxidation Event; GOE, Great Oxidation Event; Pha, Paleozoic; NP, Neoproterozoic; MP, Mesoproterozoic; PP, Paleoproterozoic.
Our Bayesian estimates suggest that the lineages that emerged earliest are SAR202, aerobic Ca. Marinimicrobia, SAR324, and the Marine Group II of the phylum Euryarchaeota (MGII). The most ancient clade was the SAR202 (2479 My, 95% CI 2465–2492 My), whose diversification took place near before the GOE (Figure 2). Given the broadly distributed aerobic capabilities of SAR202, the diversification of this clade before the GOE suggests that SAR202 emerged during an oxygen oasis proposed to have existed in pre-GOE Earth (Anbar et al., 2007; Ossa Ossa et al., 2019; Reinhard and Planavsky, 2022). The ancient pre-GOE origin of SAR202 is consistent with a recent study that proposed that this clade played a role in the shift of the redox state of the atmosphere during the GOE. SAR202 is able to partially metabolize organic matter through a flavin-dependent Baeyer–Villiger monooxygenase, thereby enhancing the burial of organic matter and contributing to the net accumulation of oxygen in the atmosphere (Landry et al., 2017; Shang et al., 2022). After the GOE, we detected the diversification of aerobic Ca. Marinimicrobia (2196 My, 95% CI 2173–2219 My), the SAR324 clade (1686 My, 95% CI 1658–1715 My), and the MGII clade (1184 My, 95% CI 1166–1202 My) (Figure 2). Although these ancient clades may have first diversified under the oxic conditions derived from the GOE, it has been suggested that the initial oxygenation of Earth was followed by a relatively rapid drop in ocean and atmosphere oxygen levels (Alcott et al., 2019; Hodgskiss et al., 2019; Reinhard and Planavsky, 2022). It is therefore likely that these clades diversified in the microaerophilic and variable oxygen conditions that prevailed during this period (Bekker et al., 2004; Holland, 2006; Holland, 2002). Indeed, the oxygen landscape in which these marine clades first diversified is consistent with their current physiology. For example, these groups are capable of using oxygen and other compounds as terminal electron acceptors (e.g., nitrate and sulfate), and several representatives are prevalent in modern marine oxygen minimum (OMZs) (Pajares et al., 2020; Sheik et al., 2014; Thrash et al., 2017; Ulloa et al., 2012). The facultative aerobic or microaerophilic metabolism in these clades is potentially a vestige of the low oxygen environment of most of the Proterozoic Eon, and in this way OMZs can be considered to be modern-day refugia of these ancient ocean conditions. Of the clades that diversified as part of this early period, MGII and SAR324 show the youngest colonization dates, but we suspect that this may be due to the notably long branches that lead to the crown nodes of these lineages. These long branches are likely caused by the absence of basal-branching members of these clades – either due to extinction events or under-sampling of rare lineages in the available genome collection – that would have increased the age of these lineages if present in the tree.
According to our analysis, the next clades to diversify in the ocean are SAR116 (959 My, 95% CI 945–973 My), SAR11 (725 My, 95% CI 715–734 My), SAR86 (503 My, 95% CI 497–509 My), SAR92 (430 My, 95% CI 423–437 My), and Roseobacter (332 My, 95% CI 323–340 My) (Figure 2). The relatively late appearance of these heterotrophic lineages that are abundant in the open ocean today was potentially due to the low productivity and oxygen concentrations in both shallow and deep waters that prevailed in the Mid-Proterozoic (1800–800 My), a period previously described as the ‘boring billion’ (Anbar and Knoll, 2002; Crockford et al., 2018; Hodgskiss et al., 2019; Planavsky et al., 2014; Tang et al., 2016). The diversification of these clades may be indirectly associated with the Snowball event registered before the Neoproterozoic Oxidation Event (NOE, 800–540 My) (Anbar and Knoll, 2002; Hoffman et al., 1998; Shields-Zhou and Och, 2011), which was followed by an increased the availability of oxygen and inorganic nutrients in the ocean (Anbar and Knoll, 2002; Butterfield, 2001; Porter, 2004; Shields-Zhou and Och, 2011; Vidal and Moczydłowska-Vidal, 1997), and is also coincident with the widespread diversification of large eukaryotic algae during the Neoproterozoic (Anbar and Knoll, 2002; Butterfield, 2001; Porter, 2004; Shields-Zhou and Och, 2011; Vidal and Moczydłowska-Vidal, 1997). It is therefore plausible that an increase in nutrients as well as the broad diversification of eukaryotic plankton enhanced the mobility of organic and inorganic nutrients beyond the coastal areas, and increased the burial of organic matter that consequently led to the rise in atmospheric oxygen concentrations (Knoll et al., 2006; Shields-Zhou and Och, 2011). The scenario in which heterotrophic marine clades diversified in part as a consequence of the new niches built by marine eukaryotes has been previously proposed to have driven the diversification of the Roseobacter clade (Luo et al., 2013; Luo and Moran, 2014). The diversification timing of Roseobacter and other heterotrophic clades supports this phenomenon and suggests that the interaction with marine eukaryotes may have broadly influenced the diversification of prevalent lineages in the modern ocean. Similar to what we observed in MGII and SAR324, the Roseobacter clade shows a long branch leading to the crown node (Figure 1), suggesting that the diversification of this clade may have occurred earlier.
We also report the diversification of the chemolithoautotrophic archaeal lineage MGI into the ocean after the NOE (678 My, 95% CI 668–688 My) (Figure 2), which is comparable with the age reported by another independent study (Yang et al., 2021). This is consistent with an increase in the oxygen concentrations of the ocean during this period (Reinhard and Planavsky, 2022), a necessary requisite for ammonia oxidation. Moreover, the widespread sulfidic conditions that likely prevailed during the Mid-Proterozoic ocean may have limited the availability of redox-sensitive metals such as copper, which is necessary for ammonia monooxygenases (Anbar and Knoll, 2002; Hatzenpichler, 2012). It is therefore plausible that a low concentration of oxygen and limited inorganic nutrient availability before the NOE were limiting factors that delayed the colonization of AOA into the ocean.
The most recent lineages to emerge include the genera Synechococcus (243 My, 95% CI 238–247 My), Prochlorococcus (230 My, 95% CI 225–234 My), and the diazotroph Crocosphaera (228 My, 95% CI 218–237 My). Our results agree with an independent study that points to a relatively late emergence of the marine picocyanobacterial clades Prochlorococcus and Synechococcus (Sánchez-Baracaldo, 2015). Picocyanobacterial clades and Crocosphaera are critical components of phytoplanktonic communities in the modern open ocean due to their large contribution to carbon and nitrogen fixation, respectively (Flombaum et al., 2013; Montoya et al., 2004; Scanlan et al., 2009). For example, the nitrogen fixation activities of Crocosphaera watsonii in the open ocean today support the demands of nitrogen-starved microbial food webs found in oligotrophic waters (Hewson et al., 2009). The relatively late diversification of these lineages suggests that the oligotrophic open ocean is a relatively modern ecosystem. Moreover, the oligotrophic ocean today is characterized by the rapid turnover of nutrients that depends on the efficient mobilization of essential elements through the ocean (Karl, 2002). Due to its distance from terrestrial nutrient inputs, productivity in the open ocean is therefore dependent on local nitrogen fixation, which was likely enhanced after the widespread oxygenation of the ocean that made molybdenum widely available due to its high solubility in oxic seawater (Canfield et al., 2007; Scott et al., 2008; Wei et al., 2021). Such widespread oxygenation was registered 430–390 My in an event referred to here as the Paleozoic Oxidation Event (POE; Berner and Raiswell, 1983; Lenton et al., 2016; Sperling et al., 2015; Tostevin and Mills, 2020; Figure 2). The increase of oxygen to present-day levels in the atmosphere and the ocean was potentially the result of an increment of the burial of organic carbon in sedimentary rocks due to the diversification of the earliest land plants (Lenton et al., 2016; Planavsky et al., 2021; Reinhard and Planavsky, 2022). The POE has also been associated with increased phosphorus weathering rates (Bergman, 2004; Lenton et al., 2016), global impacts on the global element cycles (Dahl and Arens, 2020), and an increase in the overall productivity of the ocean (Planavsky et al., 2021). The late diversification of oligotrophic-specialized clades after the POE therefore suggests that the establishment of the oligotrophic open ocean as we know it today would only have been plausible once modern oxygen concentrations and biogeochemical dynamics were reached (Karl, 2002; Reinhard and Planavsky, 2022).
To shed further light on the drivers that allowed their colonization into the ocean, we investigated whether the diversification of marine microbial clades was linked to the acquisition of novel metabolic capabilities. We broadly classified the different clades as early-branching clades (EBC), late-branching clades (LBC), and late-branching phototrophs (LBP) based on the general timing of their diversification (Figure 2). To identify the enrichment of gene functions at the crown node of each marine clade (Figure 1), we performed a stochastic mapping analysis on each of the 112,248 protein families identified in our genome dataset (Supplementary file 1). We compared our results with a null hypothesis distribution in which a constant rate model was implemented unconditionally of observed data (see ‘Materials and methods’). Statistical comparisons of the stochastic and the null distribution show that each diversification phase was associated with the enrichment of specific functional categories that were consistent with the geochemical context of their diversification (Figures 3 and 4). For example, EBC gained a disproportionate number of genes involved in DNA repair, recombination, and glutathione metabolism, consistent with the hypothesis that the GOE led to a rise in reactive oxygen species that cause DNA damage (Zaikowski et al., 2010; Khademian and Imlay, 2021; Masip et al., 2006). Moreover, the EBC were enriched in proteins involved in ancient aerobic pathways, such as oxidative phosphorylation and the TCA cycle (Figure 3), as well as genes implicated in the degradation of fatty acids under aerobic conditions, such as the enzyme alkane 1-monooxygenase in MGII (Supplementary file 4). We also detected genes for the adaptation to marine environments, including genes for the anabolism of taurine (e.g., cysteine dioxygenase in MGII, Supplementary file 4), an osmoprotectant commonly found in marine bacteria (McParland et al., 2021). Our findings suggest that the diversification of EBC in the ocean was linked to the emergence of aerobic metabolism, the acquisition of metabolic capabilities to exploit the newly created niches that followed the increase of oxygen, and the expansion of genes involved in the tolerance to salinity and oxidative stress.
Figure 3 with 1 supplement see all
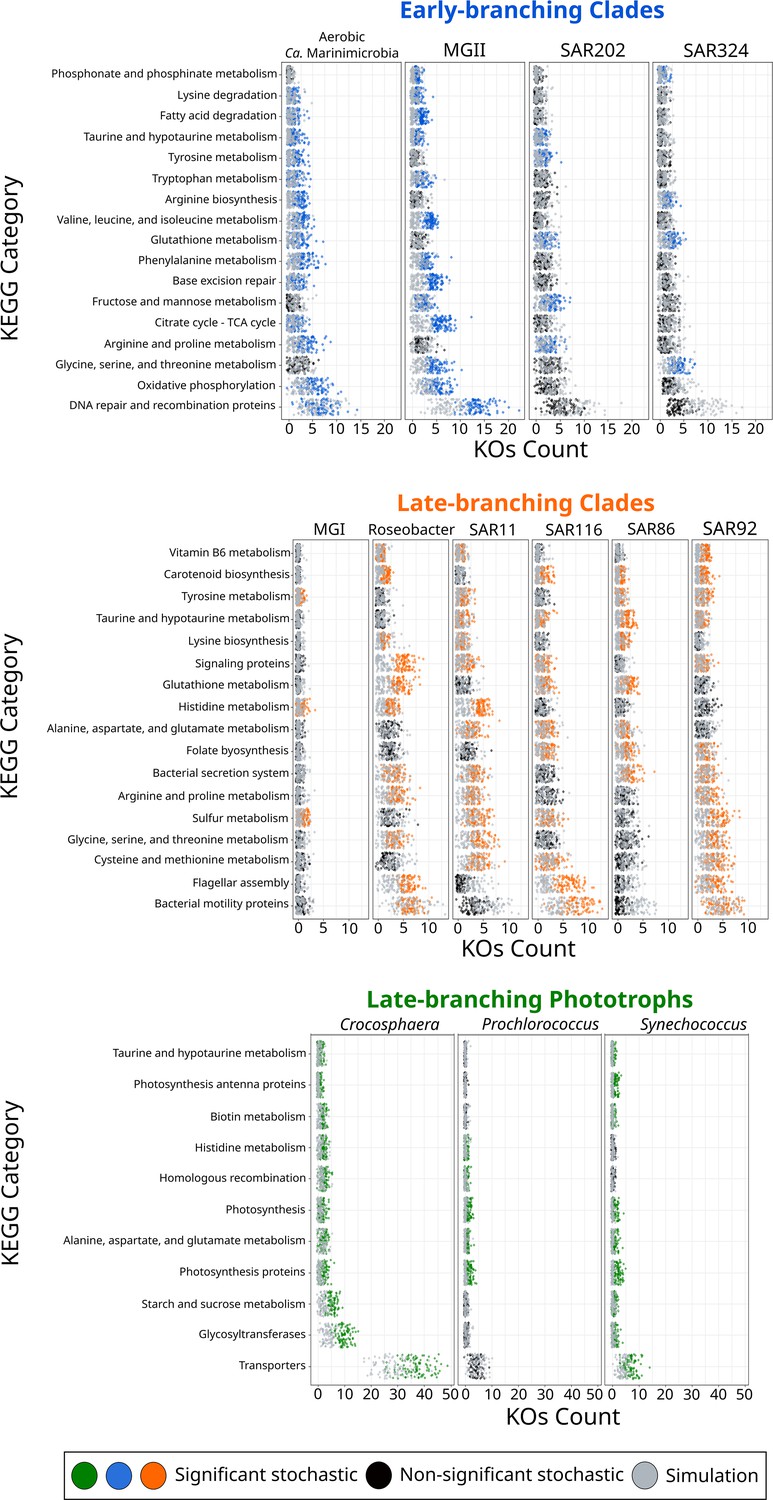
KEGG categories enriched at the crown node of each marine microbial clade.
Clades were classified based on their diversification timing shown in Figure 2. Enriched categories were identified by statistically comparing a stochastic mapping distribution with an all-rates-different model vs a null distribution with a constant rate model without conditioning on the presence/absence data at the tips of the phylogeny. Each dot represents one replicate (see ‘Materials and methods’). X-axis represents the number of KEGG Orthologous Groups (KOs) gained at each crown node for each KEGG category. Stochastic mapping and null distributions were sorted for visualization purposes. The complete list of enriched KEGGs is shown in Figure 3—figure supplement 1.
Figure 4
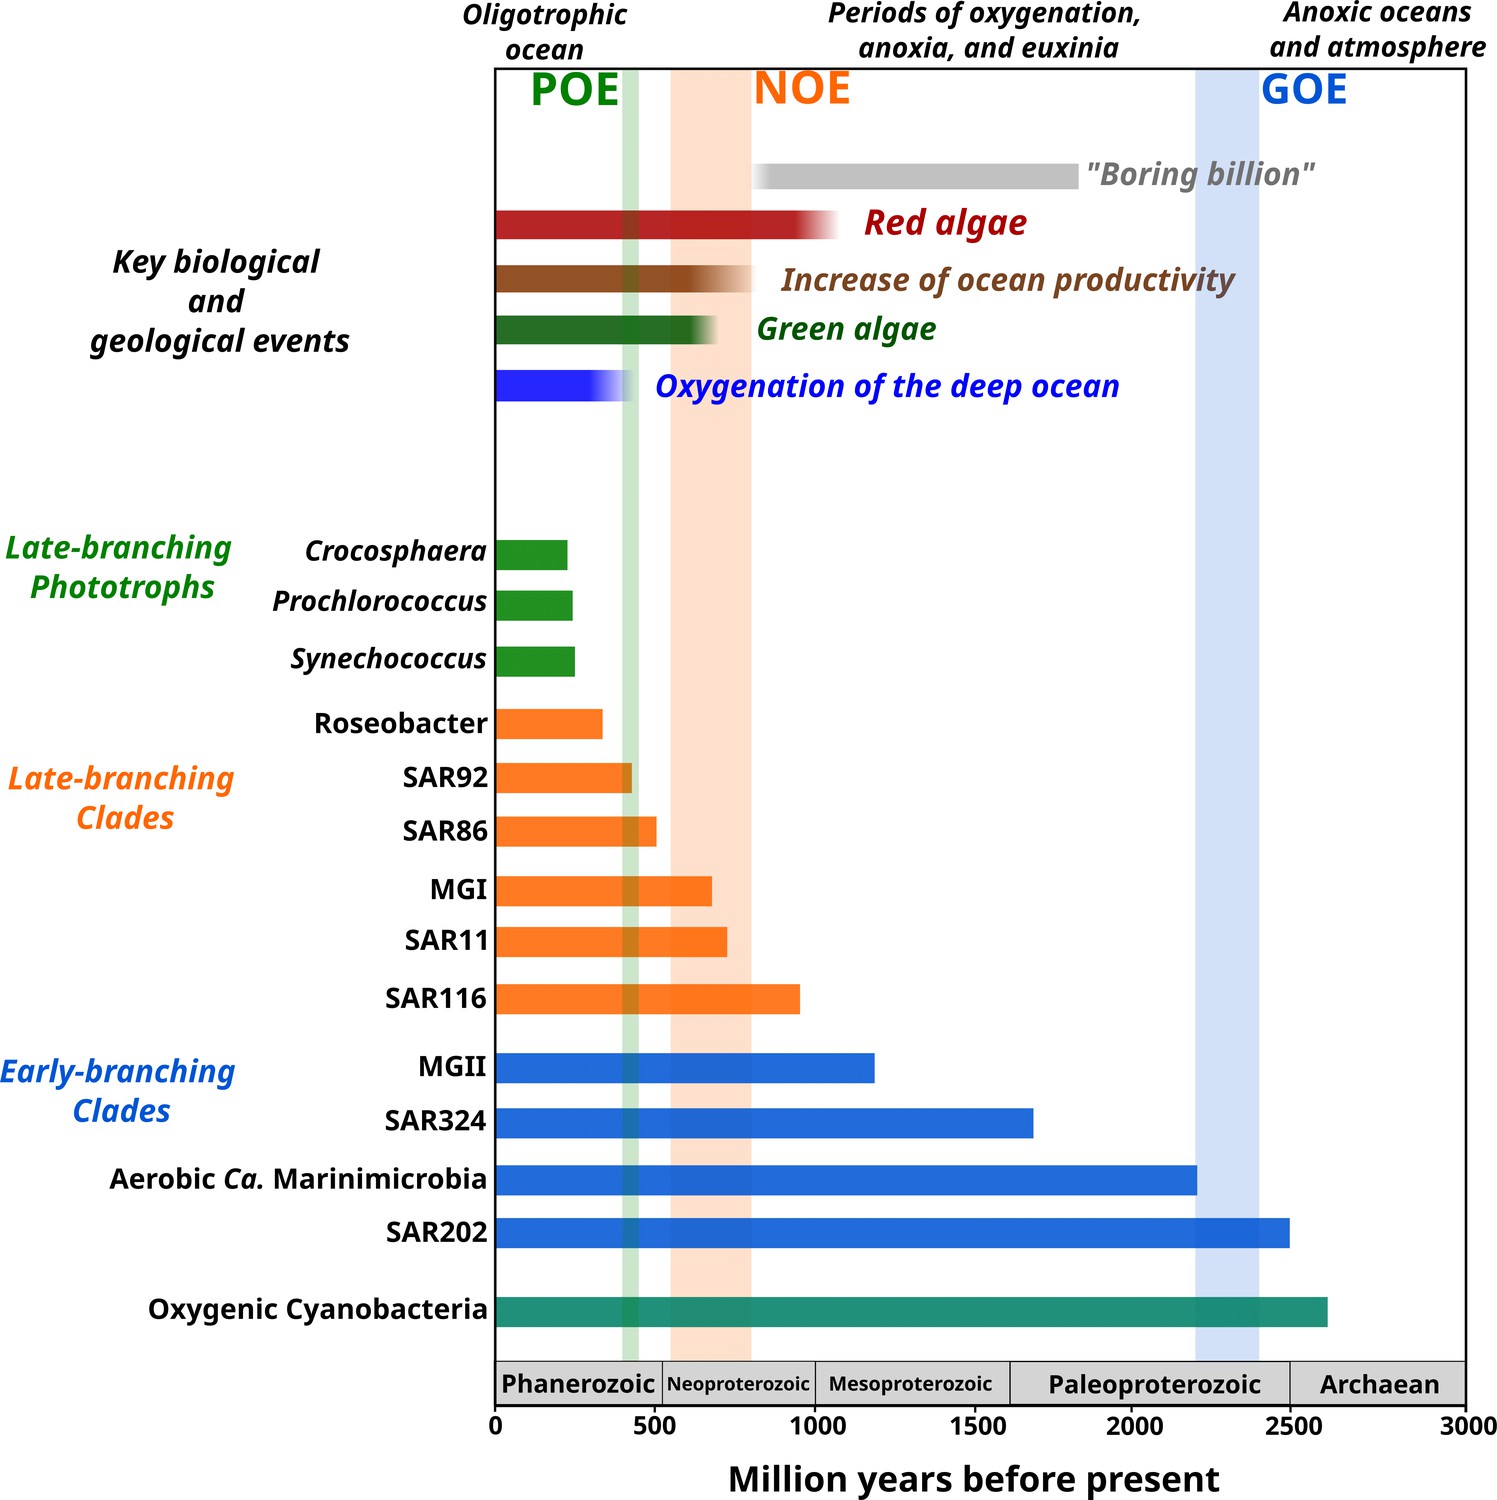
Link between the timing of the diversification of the main marine microbial clades and major geological and biological events.
The timing of the geological and biological events potentially involved in the diversification of marine clades is based on previously published data: ‘boring billion’ (Brasier and Lindsay, 1998; Hodgskiss et al., 2019), red algae fossils (Butterfield, 2000), increased of ocean productivity (Butterfield, 2000; Och and Shields-Zhou, 2012), green algae fossils (Butterfield et al., 2006), and oxygenation of the deep ocean (Lenton et al., 2016). The length of each bar represents the estimated age for marine clades according to Bayesian estimates. The timing of the main oxygenation events is based on previous work (Alcott et al., 2019).
The emergence of LBC (Figures 3 and 4), whose diversification occurred around the time of the NOE and the initial diversification of eukaryotic algae (Parfrey et al., 2011), was characterized by the enrichment of substantially different gene repertories compared to EBC (Figure 3). For instance, the heterotrophic lineages Roseobacter, SAR116, and SAR92 show an enrichment of flagellar assembly and motility genes (Figure 3), including genes for flagellar biosynthesis, flagellin, and the flagellar basal-body assembly (Supplementary file 4). Motile marine heterotrophs like Roseobacter species have been associated with the marine phycosphere, a region surrounding individual phytoplankton cells releasing carbon-rich nutrients (Mühlenbruch et al., 2018; Seymour et al., 2017). Although the phycosphere can also be established between prokaryotic phytoplankton and heterotrophs (Croft et al., 2005; Seymour et al., 2017), given the late diversification of abundant marine prokaryotic phytoplankton (Figures 2 and 4), it is plausible that the emergence of these clades was closely related to the establishment of ecological proximity with large eukaryotic algae. The potential diversification of heterotrophic LBC due to their ecological interactions with eukaryotic algae is further supported by the enrichment of genes involved in vitamin B6 metabolism and folate biosynthesis, which are key nutrients involved in phytoplankton–bacteria associations (Seymour et al., 2017). LBC were also enriched in genes for the catabolism of taurine (e.g., taurine transport system permease in SAR11 and a taurine dioxygenase in SAR86 and SAR92), suggesting that LBC gained metabolic capabilities to utilize the taurine produced by other organisms as a substrate (Clifford et al., 2019), instead of producing it as an osmoprotectant. Furthermore, we identified the enrichment of genes involved in carotenoid biosynthesis, including spheroidene monooxygenase, carotenoid 1,2-hydratase, beta-carotene hydroxylase, and lycopene beta-cyclase (Supplementary file 4). The production of carotenoids is consistent with their use in proteorhodopsin, a light-driven proton pump that is a hallmark feature of most marine heterotrophic bacteria, in particular those that inhabit energy-depleted areas of the ocean today (de la Torre et al., 2003).
LBP that diversified around the time of the POE (Figure 2) showed a remarkable enrichment of transporters in Crocosphaera and Synechococcus (Figure 3). In particular, the diversification of Crocosphaera was characterized by the acquisition of transporters for inorganic nutrients like cobalt, nickel, iron, phosphonate, phosphate, ammonium, and magnesium, along with organic nutrients including amino acids and polysaccharides (Supplementary file 4). The acquisition of a wide diversity of transporters by the Crocosphaera is consistent with their boom-and-bust lifestyle seen in the oligotrophic open ocean today (Hewson et al., 2009; Wilson et al., 2017), which requires a rapid and efficient use of scarce nutrients. We also identified genes involved in osmotic pressure tolerance, for example, a Ca-activated chloride channel homolog, a magnesium exporter, and a fluoride exporter (Supplementary file 4). In contrast, our results show that Synechococcus only acquired transporters for inorganic nutrients (e.g., iron and sulfate, Supplementary file 4), whereas Prochlorococcus did not show the enrichment of transporters (Supplementary file 4). Similar to LBC, we identified the enrichment of taurine metabolism genes in Crocosphaera and Synechococcus, suggesting that its use as osmoprotectant and potential substrate is widespread among planktonic microorganisms (Clifford et al., 2019). Prochlorococcus exhibits enrichment in fewer categories than the rest of phototrophic clades diversifying during the same period, consistent with the streamlined nature of genomes from this lineage (Partensky and Garczarek, 2010). The genes acquired by Prochlorococcus are involved in photosynthesis, which supports previous findings that the diversification of this clade was accompanied by changes in the photosynthetic apparatus compared with Synechococcus, its sister group (Biller et al., 2015). Overall, the diversification of LBP was marked by the capacity to thrive in the oligotrophic ocean by exploiting organic and inorganic nutrients and by the modifying the photosynthetic apparatus as observed in Crocosphaera and Synechococcus, and Prochlorococcus, respectively.
Conclusion
The contemporary ocean is dominated by abundant clades of bacteria and archaea that drive global biogeochemical cycles and play a central role in shaping the redox state of the planet. Despite their importance, the timing and geological landscape in which these clades colonized the ocean have remained unclear due to a combination of the inherent difficulties of studying biological events that occurred in deep time and the lack of a fossil record for microbial life. Yet establishing a timeline of these events is critical because the colonization of major marine lineages led to the establishment of the biogeochemical cycles that govern the environmental health of the planet today. In this study, we develop a novel phylogenomic method that allows us to infer a comprehensive timeline of the colonization of the ocean by abundant marine clades of both bacteria and archaea. Importantly, our study presents key foundational knowledge for understanding ongoing anthropogenic changes in the ocean. Climate change is predicted to lead to an expansion of both oxygen minimum zones, which our findings suggest are refugia that date back to the mid-Proterozoic ocean, and oligotrophic surface waters, which represent ecosystems that emerged relatively recently in the Phanerozoic (Figure 4). Thus, the impacts of current global change can manifest similarly in ecosystems that have emerged at dramatically different periods of Earth’s history. Knowledge of how and under what geochemical conditions dominant microbial constituents first diversified provides context for understanding the impact of climatic changes on the marine biome more broadly and will help clarify how continuing ecological shifts will impact marine biogeochemical cycles.
Materials and methods
Genome sampling and phylogenetic reconstruction
Request a detailed protocolTo obtain a comprehensive understanding of the diversification of the main marine planktonic clades, we built a multi-domain phylogenetic tree that included a broad diversity of bacterial and archaeal genomes. We compiled a balanced genome dataset from the Genome Taxonomy Database (GTDB, v95; Chaumeil et al., 2019), including marine representatives, by using a genome sampling strategy reported previously (Martinez-Gutierrez and Aylward, 2021). In addition, we improved the representation of marine clades by subsampling genomes from the GORG database (Pachiadaki et al., 2019), which includes a wide range of genomes derived from single-cell sequencing, and added several Thermoarchaeota genomes available on the JGI (Nordberg et al., 2014). We discarded genomes belonging to the DPANN superphylum due to the uncertainty of their placement within the archaea (Martinez-Gutierrez and Aylward, 2021). The list of genomes used is reported in Supplementary file 1.
We reconstructed a phylogenetic tree through the benchmarked MarkerFinder pipeline developed previously (Martinez-Gutierrez and Aylward, 2021), which resulted in an alignment of 27 ribosomal genes and 3 RNA polymerase genes (RNAP) (Martinez-Gutierrez and Aylward, 2021). The MarkerFinder pipeline consists of (1) the identification of ribosomal and RNAP genes using HMMER v3.2.1 with the reported model-specific cutoffs (Eddy and Pearson, 2011; Sievers and Higgins, 2018), (2) alignment with ClustalOmega (Sievers and Higgins, 2018), and (3) concatenation of individual alignments. The resulting concatenated alignment was trimmed using trimAl (Capella-Gutiérrez et al., 2009) with the option -gt 0.1. Phylogenetic tree inference was carried out with IQ-TREE v1.6.12 (Nguyen et al., 2015) with the options -wbt, -bb 1000 (Minh et al., 2013), -m LG +R10 (substitution model previously selected with the option -m MFP according to the Bayesian Information Criterion (BIC); Kalyaanamoorthy et al., 2017), and --runs 5 to select the tree with the highest likelihood. The tree with the highest likelihood was manually inspected to discard the presence of topological inconsistencies and artifacts on iTOL (Letunic and Bork, 2019; Figure 1). The raw phylogenetic tree is presented in Supplementary file 2. In a previous study, we assessed the effect of substitution model selection on the topology of a multi-domain phylogenetic tree (Martinez-Gutierrez and Aylward, 2021); however, we did not observe topological changes between the substitution models LG + C60 and LG + R10 (model selected according to the BIC criterion).
Assessment of tree quality
Request a detailed protocolDue to the key importance of tree quality for the tree-dependent analysis performed in our study, we assessed the congruence of our prokaryotic ToL through the Tree Certainty metric (TC) (Martinez-Gutierrez and Aylward, 2021; Salichos et al., 2014), which has recently been shown to be a more accurate estimate for phylogenetic congruence than the traditional bootstrap. Our estimate based on 1000 replicate trees (TC = 0.91) indicates high congruence in our phylogeny, indicating that the phylogenetic signal across our concatenated alignment of marker genes is consistent. We also evaluated whether the topology of our ToL agrees with a high-quality prokaryotic ToL reported previously (Martinez-Gutierrez and Aylward, 2021). In general, we observed consistency in the placement of all the phyla, as well as the bacterial superphyla (Terrabacteria and Gracilicutes) between both trees, except for the sisterhood of Actinobacteriota and Armatimonadota, which differs from the sisterhood of Actinobacteriota and Firmicutes in the reference tree (Martinez-Gutierrez and Aylward, 2021). We do not expect these discrepancies to substantially impact the results of our study because none of the marine clades are within this region of the tree.
Estimating the age of the crown node of bacterial and archaeal marine clades
Request a detailed protocolTo investigate the timing of the diversification of the marine planktonic clades, the phylogenetic tree obtained above was used to perform a molecular dating analysis of the crown nodes leading to the diversification of the main marine microbial clades. We focused our analysis on clades of bacteria and archaea that are overwhelmingly marine, such that the evolutionary history of that clade could be clearly traced back to an ancestral colonization of the ocean. Some clades, such as marine Nitrospinae and Actinobacteria were not considered because they included several non-marine members, and it was unclear whether these lineages colonized the ocean multiple times independently. Our analysis was performed through Phylobayes v4.1c (Lartillot et al., 2009) with the program pb on four independent chains. For each chain, the input consisted in the phylogenetic tree, the amino acid alignment, the calibrations, and an autocorrelated relaxed log normal model (-ln) (Thorne et al., 1998) with the molecular evolution model CAT-Poisson + G4. Convergence was tested every 5000 cycles using the program tracecomp with a burn-in of 250 cycles and sampling every 2 cycles. After 100,000 cycles, our chains reached convergence in 8 out of 12 parameters (Supplementary file 3). To assess the uncertainty derived from the parameters that did not reach convergence, we estimated the divergence ages with the program readdiv using the last 1000 cycles and testing every 10 cycles of the four chains of our Bayesian analysis (Figure 2—figure supplement 1). Although some Bayesian parameters did not reach convergence after 100,000 cycles , the estimated ages resulting from our four independent chains were similar when compared to each other (Figure 2—figure supplement 1). However, we observed an overall decrease in consistency between chains in the earliest clades (MGII, SAR324, Aerobic Ca. Marinimicrobia, and SAR202). This discrepancy is probably due to a decline in phylogenetic signal toward the root of the phylogenetic tree (Philippe et al., 2011).
Selection of priors and assessment of priors’ impact on posterior distribution
Request a detailed protocolTo determine the suitability and impact of our priors on the age estimates of the calibrated nodes, we ran an independent MCMC chain without the amino acid alignment using the option -root on Phylobayes. Our prior-only analysis yielded a posterior age falling within the maximum and minimum priors used for the crown group of archaea and bacteria. For the internally calibrated nodes, we observed posterior estimates consistent with the priors used for each case except for aerobic ammonia-oxidizing archaea (Figure 2-figure supplement 2). Overall, this result suggests that the calibrations used as priors were adequate for our analyses.
Molecular dating analysis based on penalized likelihood and assessment of priors role on age estimates
Request a detailed protocolWe evaluated the reproducibility of our Bayesian divergence estimates by running an additional analysis based on penalized likelihood (PL) using TreePL (Smith and O’Meara, 2012) on 1000 replicate trees. Replicate trees were generated with the program bsBranchLenghts available on RAxML v8.2.12 (Stamatakis, 2014). For each of the 1000 replicate runs, we initially used the option ‘prime’ on TreePL to identify the optimization parameters and applied the parameter ‘through’ to continue iterations until parameter convergence. Moreover, we estimated the optional smoothing value for each replicate tree and ran cross-validation with the options ‘cv’ and ‘randomcv.’ The divergence times resulting from the 1000 bootstrap trees were used to assess the age variation for each marine microbial clade (Figure 2—figure supplement 1). Moreover, we used a PL approach to assess the role of calibrations on age estimates by using two different sets of priors. The first set consisted in using the priors shown in Table 1 (Priors set 1) and the second set included the independent calibration of the bacterial and archaeal root and the calibration of the crown node of oxygenic Cyanobacteria (Priors set 2).
Assessing the role of molecular dating strategy, molecular dating rate model, and calibrations on the diversification timing estimates of marine microbial clades
Request a detailed protocolIn order to evaluate the reproducibility of our Bayesian molecular dating analysis and assess the reliability of the calibration points used (Figure 2), we applied multiple additional molecular dating analyses. Firstly, using the same calibrations, we applied a second independent approach based on Penalized likelihood (PL) (Smith and O’Meara, 2012) (see previous section). We found consistency in the age estimates between PL and Bayesian except for the clades Prochlorococcus and Synechococcus, which showed a more recent diversification when using a Bayesian approach (Figure 2—figure supplement 3). Secondly, we evaluated the role of model selection on our Bayesian posterior estimates by running two additional Bayesian analyses under the relaxed molecular clock models CIR (Autocorrelated CIR process; Lepage et al., 2007) and UGAM (Uncorrelated Gamma Multiplies; Drummond et al., 2006) available on Phylobayes. Overall, our estimates once again revealed broad consistency across models, with the exception that SAR11 and SAR86 had notably earlier divergence times with the CIR and UGAM models relative to the log-normal model. Previous research has shown that autocorrelated models outperform uncorrelated models when tested in different datasets (Lepage et al., 2007), which would suggest that the autocorrelated log-normal and CIR models provide the most robust estimates in our analysis. Indeed, for SAR86 the UGAM model provided an unusually early diversification date that is an outlier compared to all other estimates (Figure 2—figure supplement 3).
Lastly, due to the potential limitations of using the oxygenation of the atmosphere (GOE) as a maximum prior for the strict aerobic metabolism of aerobic Ca. Marinimicrobia, ammonia-oxidizing archaea, and nitrate-oxidizing bacteria (Table 1), we performed an additional molecular dating analysis using a PL approach in which these priors were excluded (Priors set 2; Figure 2—figure supplement 3). Our analysis once again showed similar divergence times in all marine clades regardless of the priors used (Figure 2—figure supplement 3), indicating that the use of these calibrations did not strongly shape our results. Importantly, the overall consistency in our age estimates using different molecular dating approaches, models, and priors does not alter our main conclusions regarding the emergence of marine microbial clades and the geochemical context in which they first diversified.
Comparing Bayesian diversification estimates with previous studies
Request a detailed protocolTwo estimated divergence times shown in our study disagree with previously published analyses. Firstly, a recent molecular dating estimate suggested that the transition of AOA-Archaea from terrestrial environments into marine reals occurred before the NOE (Ren et al., 2019) during a period known as the ‘boring million’ characterized by low productivity and minimum oxygen concentrations in the atmosphere (0.1% the present levels) (Anbar and Knoll, 2002; Hodgskiss et al., 2019; Holland, 2006; Reinhard and Planavsky, 2022). Our estimates point to a later diversification of this lineage during or after the NOE (678 My, 95% CI 668–688 My) (Figure 2), which is comparable with the age reported by another independent study (Yang et al., 2021). Secondly, another study reported the origin of the Picocyanobacterial clade Prochlorococcus to be 800 My, before the Snowball Earth period registered during the Cryogen (Zhang et al., 2021). However, our results agree with another independent study that points to a relatively late evolution of Prochlorococcus (Sánchez-Baracaldo, 2015).
Orthologous groups detection, stochastic mapping, and functional annotation
Request a detailed protocolTo investigate the genomic novelties associated with the diversification of the marine microbial lineages considered in our study, we identified enriched KEGG categories in the crown node of each clade. First, we predicted protein orthologous groups with ProteinOrtho v6 (Lechner et al., 2011) using the option ‘lastp’ and the protein files downloaded from the GTDB, GORG, and JGI databases. Furthermore, we performed a functional annotation using the KEGG database (Kanehisa, 2019; Kanehisa et al., 2021; Kanehisa and Goto, 2000) through HMMER3 with an e-value of 10–5 on all proteins. Proteins with multiple annotations were filtered to keep the best-scored annotation, and we predicted the function of each protein orthologous group by using the Majority Rule Principle. The presence/absence matrix resulting from the identification of orthologous groups was used together with our phylogenetic tree to perform 100 replicate stochastic mapping analyses on each orthologous group with the make.simmap function implemented on Phytools (Bollback, 2006; Revell, 2012) with the model ‘all-rates-different’ (ARD). To evaluate evidence of enrichment of KEGG categories, we simulated a null distribution for each protein cluster under the transition matrix estimated from our stochastic mapping analysis using the function sim.history, but without conditioning on the presence/absence data at the tips (i.e., simulating a constant rate null distribution of transitions across the tree). Since some of the protein clusters show a low exchange rate (identified because one of the rows in the Q-matrix was equal to zero), we manually changed the exchange rate from 0 to 0.00001. For each distribution, we estimated the number of genes gained for each KEGG category at the crown node of the marine clades. Clusters without a known annotation on the KEGG database were discarded. The resulting KEGG category distributions for our stochastic mapping and null analyses were statistically compared using a one-tailed Wilcoxon test (α = 0.01, N = 100 for each distribution). KEGG categories showing statistically more gains in our stochastic mapping distribution were considered enriched (Figure 3—figure supplement 1).
Data availability
The main code used in our study is deposited on GitHub: https://github.com/carolinaamg/enriched_OG (copy archived at Carolinaamg, 2023).
References
-
COPSE: A new model of biogeochemical cycling over Phanerozoic timeAmerican Journal of Science 304:397–437.https://doi.org/10.2475/ajs.304.5.397
-
Burial of organic carbon and pyrite sulfur in sediments over phanerozoic time: a new theoryGeochimica et Cosmochimica Acta 47:855–862.https://doi.org/10.1016/0016-7037(83)90151-5
-
Prochlorococcus: the structure and function of collective diversityNature Reviews. Microbiology 13:13–27.https://doi.org/10.1038/nrmicro3378
-
What is the metabolic state of the oligotrophic ocean? A debateAnnual Review of Marine Science 5:525–533.https://doi.org/10.1146/annurev-marine-121211-172331
-
Accelerated Profile HMM SearchesPLOS Computational Biology 7:e1002195.https://doi.org/10.1371/journal.pcbi.1002195
-
Diversity, physiology, and niche differentiation of ammonia-oxidizing archaeaApplied and Environmental Microbiology 78:7501–7510.https://doi.org/10.1128/AEM.01960-12
-
A neoproterozoic snowball earthScience 281:1342–1346.https://doi.org/10.1126/science.281.5381.1342
-
Volcanic gases, black smokers, and the great oxidation eventGeochimica et Cosmochimica Acta 66:3811–3826.https://doi.org/10.1016/S0016-7037(02)00950-X
-
The oxygenation of the atmosphere and oceansPhilosophical Transactions of the Royal Society of London. Series B, Biological Sciences 361:903–915.https://doi.org/10.1098/rstb.2006.1838
-
KEGG: kyoto encyclopedia of genes and genomesNucleic Acids Research 28:27–30.https://doi.org/10.1093/nar/28.1.27
-
Toward understanding the origin and evolution of cellular organismsProtein Science 28:1947–1951.https://doi.org/10.1002/pro.3715
-
KEGG: integrating viruses and cellular organismsNucleic Acids Research 49:D545–D551.https://doi.org/10.1093/nar/gkaa970
-
Nutrient dynamics in the deep blue seaTrends in Microbiology 10:410–418.https://doi.org/10.1016/s0966-842x(02)02430-7
-
How microbes evolved to tolerate oxygenTrends in Microbiology 29:428–440.https://doi.org/10.1016/j.tim.2020.10.001
-
Eukaryotic organisms in Proterozoic oceansPhilosophical Transactions of the Royal Society of London. Series B, Biological Sciences 361:1023–1038.https://doi.org/10.1098/rstb.2006.1843
-
A general comparison of relaxed molecular clock modelsMolecular Biology and Evolution 24:2669–2680.https://doi.org/10.1093/molbev/msm193
-
Interactive Tree Of Life (iTOL) v4: recent updates and new developmentsNucleic Acids Research 47:W256–W259.https://doi.org/10.1093/nar/gkz239
-
Evolutionary ecology of the marine Roseobacter cladeMicrobiology and Molecular Biology Reviews 78:573–587.https://doi.org/10.1128/MMBR.00020-14
-
Phylogenetic signal, congruence, and uncertainty across bacteria and archaeaMolecular Biology and Evolution 38:5514–5527.https://doi.org/10.1093/molbev/msab254
-
The many faces of glutathione in bacteriaAntioxidants & Redox Signaling 8:753–762.https://doi.org/10.1089/ars.2006.8.753
-
Ultrafast approximation for phylogenetic bootstrapMolecular Biology and Evolution 30:1188–1195.https://doi.org/10.1093/molbev/mst024
-
IQ-TREE: a fast and effective stochastic algorithm for estimating maximum-likelihood phylogeniesMolecular Biology and Evolution 32:268–274.https://doi.org/10.1093/molbev/msu300
-
The genome portal of the department of energy joint genome institute: 2014 updatesNucleic Acids Research 42:D26–D31.https://doi.org/10.1093/nar/gkt1069
-
Prochlorococcus: advantages and limits of minimalismAnnual Review of Marine Science 2:305–331.https://doi.org/10.1146/annurev-marine-120308-081034
-
Evolution of the structure and impact of Earth’s biosphereNature Reviews Earth & Environment 2:123–139.https://doi.org/10.1038/s43017-020-00116-w
-
The fossil record of early eukaryotic diversificationThe Paleontological Society Papers 10:35–50.https://doi.org/10.1017/S1089332600002321
-
The history of ocean oxygenationAnnual Review of Marine Science 14:331–353.https://doi.org/10.1146/annurev-marine-031721-104005
-
phytools: an R package for phylogenetic comparative biology (and other things)Methods in Ecology and Evolution 3:217–223.https://doi.org/10.1111/j.2041-210X.2011.00169.x
-
Novel information theory-based measures for quantifying incongruence among phylogenetic treesMolecular Biology and Evolution 31:1261–1271.https://doi.org/10.1093/molbev/msu061
-
Origin of marine planktonic cyanobacteriaScientific Reports 5:17418.https://doi.org/10.1038/srep17418
-
Insights into the evolution of picocyanobacteria and phycoerythrin genes (mpeBA and cpeBA)Frontiers in Microbiology 10:00045.https://doi.org/10.3389/fmicb.2019.00045
-
Ecological genomics of marine picocyanobacteriaMicrobiology and Molecular Biology Reviews 73:249–299.https://doi.org/10.1128/MMBR.00035-08
-
Oxidative metabolisms catalyzed Earth’s oxygenationNature Communications 13:1328.https://doi.org/10.1038/s41467-022-28996-0
-
Metabolic flexibility of enigmatic SAR324 revealed through metagenomics and metatranscriptomicsEnvironmental Microbiology 16:304–317.https://doi.org/10.1111/1462-2920.12165
-
Clustal Omega for making accurate alignments of many protein sequencesProtein Science 27:135–145.https://doi.org/10.1002/pro.3290
-
Extremely low oxygen concentration in mid-Proterozoic shallow seawatersPrecambrian Research 276:145–157.https://doi.org/10.1016/j.precamres.2016.02.005
-
Estimating the rate of evolution of the rate of molecular evolutionMolecular Biology and Evolution 15:1647–1657.https://doi.org/10.1093/oxfordjournals.molbev.a025892
-
Hadean age for a post-magma-ocean zircon confirmed by atom-probe tomographyNature Geoscience 7:219–223.https://doi.org/10.1038/ngeo2075
-
Timescales of Oxygenation Following the Evolution of Oxygenic PhotosynthesisOrigins of Life and Evolution of the Biosphere 46:51–65.https://doi.org/10.1007/s11084-015-9460-3
-
The Evolution Pathway of Ammonia-Oxidizing Archaea Shaped by Major Geological EventsMolecular Biology and Evolution 38:3637–3648.https://doi.org/10.1093/molbev/msab129
-
BookChemical evolution II: from the origins of life to modern societyIn: Burrows CJ, editors. Surviving an Oxygen Atmosphere: DNA Damage and Repair. Washington DC: ACS Symposium Series. pp. 147–156.https://doi.org/10.1021/bk-2009-1025
-
Nitrogen cycle of the open ocean: from genes to ecosystemsAnnual Review of Marine Science 3:197–225.https://doi.org/10.1146/annurev-marine-120709-142819
-
Snowball Earth, population bottleneck and evolutionProceedings. Biological Sciences 288:20211956.https://doi.org/10.1098/rspb.2021.1956
Peer review
Reviewer #1 (Public Review):
Martinez-Gutierrez and colleagues presented a timeline of important bacteria and archaea groups in the ocean and based on this they correlated the emergence of these microbes with GOE and NOE, the two most important geological events leading to the oxygen accumulation of the Earth.
The following suggestion is very important and requires additional clock analysis.
"Three calibrations at Aerobic Nitrososphaerales, Aerobic Marinimicrobia, and Nitrite oxidizing bacteria have the same problem - they are all assumed to have evolved after the GOE where the Earth started to accumulate oxygen in the atmosphere, so they were all capped at 2320 Ma. This is an important mistake and will significantly affect the age estimates because maximum constraint was used (maximum constraint has a much greater effect on age estimates and minimum constraint), and this was used in three nodes involving both Bacteria and Archaea. The main problem is that the authors ignored the numerous evidence showing that oxygen can be produced far before GOE by degradation of abiotically-produced abundant H2O2 by catalases equipped in many anaerobes, also produced by oxygenic cyanobacteria evolved at least 500 Ma earlier than the onset of GOE (2500 Ma), and even accumulated locally (oxygen oasis). It is well possible that aerobic microbes could have evolved in the Archaean."
https://doi.org/10.7554/eLife.88268.3.sa1Reviewer #2 (Public Review):
In this paper, Martinez-Gutierrez and colleagues present a dated, multidomain ( = Archaea+Bacteria) phylogenetic tree, and use their analyses to directly compare the ages of various marine prokaryotic groups. They also perform ancestral gene content reconstruction using stochastic mapping to determine when particular types of genes evolved in marine groups.
Overall, there are not very many papers that attempt to infer a dated tree of all prokaryotes, and this is a distinctive and up-to-date new contribution to that oeuvre. There are several particularly novel and interesting aspects - for example, using the GOE as a (soft) maximum age for certain groups of strictly aerobic Bacteria, and using gene content enrichment to try to understand why and how particular marine groups radiated.
One overall feature of the results is that marine groups tend to be quite young, and there don't seem to be any modern marine groups that were in the ocean prior to the GOE. This seems an interesting strand to pursue in future work. Presumably, the earliest branches of the bacterial tree were marine, so what happened in the intervening period? The authors' character mapping approach could also be used to infer the habitat of the Gracilicutes and Terrabacteria ancestors, and it might be interesting to revisit the question of the ancestral ecological differences between these groups, if any can be clearly distinguished.
Finally, some comments in which I disagree with a couple of the authors' methodological decisions. I don't think these disagreements are likely to have a major impact on the findings, but I feel it is worth mentioning them in any case, to stimulate future discussion and work. I very much appreciate that finding time calibrations for microbes is challenging, but I nonetheless have a couple of comments or concerns about the calibrations used here.
1. It is not clear that the earliest evidence for biogenic methane provides a minimum age for both Bacteria and Archaea. For Archaea, potentially --- if the methane is indeed biogenic, and if the last archaeal common ancestor was a methanogen. For Bacteria (and extant life as a whole), the link is harder to draw. The authors pointed out that there is other evidence from around this time for life, for example from the Strelley Pool at ~3.3Ga. This is a reasonable argument for a minimum on LUCA, but then the optimal approach would be to calibrate the root node with this minimum, rather than the two descendant clades.
2. I am also unclear about the rationale for setting the minimum age of the photosynthetic Cyanobacteria crown to the time of the GOE. Presumably, oxygen-generating photosynthesis evolved on the stem of (photosynthetic) Cyanobacteria - since the crown seems to have had it ancestrally - and it therefore seems possible that the GOE might have been initiated by these stem Cyanobacteria, with the crown radiating later. In their response to my comment, the authors confirm that they are calibrating the crown Cyanobacteria using the GOE as a minimum. I don't agree with the logic here: it seems a formal possibility that crown Cyanobacteriia are younger than the GOE. The authors argued that, although oxygenic photosynthesis likely evolved on the stem, due to extinction (or non-sampling) of intervening lineages there are no nodes on the tree that directly sample that event. I agree, but I would then suggest placing the minimum on the older, not the younger, end of the stem.
https://doi.org/10.7554/eLife.88268.3.sa2Author response
The following is the authors’ response to the original reviews.
Thank you for your time and effort in handling and reviewing our manuscript. We have responded to all comments below.
Reviewer #1 (Public Review):
Martinez-Gutierrez and colleagues presented a timeline of important bacteria and archaea groups in the ocean and based on this they correlated the emergence of these microbes with GOE and NOE, the two most important geological events leading to the oxygen accumulation of the Earth. The whole study builds on molecular clock analysis, but unfortunately, the clock analysis contains important errors in the calibration information the study used, and is also oversimplified, leaving many alternative parameters that are known to affect the posterior age estimates untested. Therefore, the main conclusion that the oxygen availability and redox state of the ocean is the main driver of marine microbial diversification is not convincing.
We do not conclude that “oxygen availability and redox state of the ocean is the main driver of marine microbial diversification”. Our conclusion is much more nuanced. We merely discuss our findings in light of the major oxygenation events and oxygen availability (among other things) given the important role this molecule has played in shaping the redox state of the ocean.
Regarding the methodological concerns, to address them we have provided additional analyses to account for different clock models and calibration points.
Basically, what the molecular clock does is to propagate the temporal information of the nodes with time calibrations to the remaining nodes of the phylogenetic tree. So, the first and the most important step is to set the time constraints appropriately. But four of the six calibrations used in this study are debatable and even wrong.
(1) The record for biogenic methane at 3460 Ma is not reliable. The authors cited Ueno et al. 2006, but that study was based on carbon isotope, which is insufficient to demonstrate biogenicity, as mentioned by Alleon and Summons 2019.
Thank you for pointing out the limitations of using the geochemical evidence of methane as calibrations. Indeed, several commentaries have suggested that the biotic and abiotic origin of the methane reported by Ueno et al. are equally plausible (Alleon and Summons, 2019; Lollar and McCollom, 2006), however; we used that calibration as a minimum for the presence of life on Earth, not methanogenesis. Despite the controversy regarding the origin of methane, there are other lines of evidence suggesting the presence of life around ~3.4 Ga. For example stromatolites from the Dresser Formation, Pilbara, Western Australia (Djokic et al., 2017; Walter et al., 1980; Buick and Dunlop, 1990), and more recently (Hickman-Lewis et al., 2022). To avoid confusion, we have added a more extended explanation for the use of that calibration and additional evidence of life around that time in Table 1 and lines 100-104.
(2) Three calibrations at Aerobic Nitrososphaerales, Aerobic Marinimicrobia, and Nitrite oxidizing bacteria have the same problem - they are all assumed to have evolved after the GOE where the Earth started to accumulate oxygen in the atmosphere, so they were all capped at 2320 Ma. This is an important mistake and will significantly affect the age estimates because maximum constraint was used (maximum constraint has a much greater effect on age estimates and minimum constraint), and this was used in three nodes involving both Bacteria and Archaea. The main problem is that the authors ignored the numerous evidence showing that oxygen can be produced far before GOE by degradation of abiotically-produced abundant H2O2 by catalases equipped in many anaerobes, also produced by oxygenic cyanobacteria evolved at least 500 Ma earlier than the onset of GOE (2500 Ma), and even accumulated locally (oxygen oasis). It is well possible that aerobic microbes could have evolved in the Archaean.
We appreciate the suggestion of assessing the validity of the calibrations used in our analyses. We initially evaluated the informative power of the priors used for the Bayesian molecular dating (Supplemental File 5), and found that the only calibration that lacked enough information for the purposes of our study was Ammonia Oxidizing Archaea (AOA). In contrast to previous evidence (Ren et al., 2019; Yang et al., 2021), we associate this finding to the potential earlier diversification of AOA. Due to the limitations of several of the calibrations used, we performed an additional molecular dating analysis on 1000 replicate trees using a Penalized Likelihood strategy. This analysis consisted in excluding the calibrations that assumed the presence of oxygen as a maximum constraint. Our analysis shows similar age estimates of the marine microbial clades regardless of the exclusion of these calibrations (Supplemental File 8; TreePL Priors set 2). Our findings thus suggest that the age estimates reported in our study are consistent regardless of whether or not the presence of oxygen is used to calibrate several nodes in the tree. We describe the results of this analysis in lines 490-499 and include estimates in Supplemental File 8. Our results are therefore robust regardless of the use of these somewhat controversial calibrations.
Once the phylogenetic tree is appropriately calibrated with fossils and other time constraints, the next important step is to test different clock models and other factors that are known to significantly affect the posterior age estimates. For example, different genes vary in evolutionary history and evolutionary rate, which often give very different age estimates. So it is very important to demonstrate that these concerns are taken into account. These are done in many careful molecular dating studies but missing in this study.
We agree that the selection of marker genes will have a profound impact on the final age estimates. First, it is important to understand that very few genes present in modern Bacteria and Archaea can be traced back to the Last Universal Common Ancestor, so there are very few genes to use for this purpose. Studies that focus on particular groups of Bacteria and Archaea may have larger selections of genes to choose from, but for our purposes there are only about ~40 different genes - mostly encoding for ribosomal proteins, RNA polymerase subunits, and tRNA synthetases - that can be use for this purpose (Creevey et al., 2011; Wu and Scott, 2012). In a previous study we have extensively benchmarked methods for the reconstruction of high-resolution phylogenetic trees of Bacteria and Archaea using these genes (Martinez-Gutierrez and Aylward, 2021). Our analyses demonstrated that some of these genes (mainly tRNA synthetases) have undergone ancient lateral gene transfer events and are not suitable for deep phylogenetics or molecular dating. In this previous study we also evaluated different sets of marker genes to examine which provide the most robust phylogenetic inference. We arrived at a set of ribosomal proteins and RNA polymerase subunits that performs best for phylogenetic reconstruction, and we have used that in the current study.
Furthermore, we tested the role of molecular dating model selection on the final Bayesian estimates by running four independent chains under the models UGAM and CIR, respectively. Overall, the results did not vary substantially compared with the ages obtained using the log-normal model reported on our manuscript (Supplemental File 8). The additional results are described in lines 478-488 and shown in Supplemental File 8. The clades that showed more variation when using different Bayesian models were SAR86, SAR11, and Crown Cyanobacteria (Supplemental File 8). Despite observing some differences in the age estimates when using different molecular models, the conclusion that the different marine microbial clades presented in our study diversified during distinct periods of Earth’s history remains. Moreover, the main goal of our study is to provide a relative timeline of the diversification of abundant marine microbial clades without focusing on absolute dates.
Reviewer #2 (Public Review):
In this paper, Martinez-Gutierrez and colleagues present a dated, multidomain ( = Archaea+Bacteria) phylogenetic tree, and use their analyses to directly compare the ages of various marine prokaryotic groups. They also perform ancestral gene content reconstruction using stochastic mapping to determine when particular types of genes evolved in marine groups.
Overall, there are not very many papers that attempt to infer a dated tree of all prokaryotes, and this is a distinctive and up-to-date new contribution to that oeuvre. There are several particularly novel and interesting aspects - for example, using the GOE as a (soft) maximum age for certain groups of strictly aerobic Bacteria, and using gene content enrichment to try to understand why and how particular marine groups radiated.
Thank you for your thorough evaluation and comments on our manuscript.
Comments
One overall feature of the results is that marine groups tend to be quite young, and there don't seem to be any modern marine groups that were in the ocean prior to the GOE. It might be interesting to study the evolution of the marine phenotype itself over time; presumably some of the earlier branches were marine? What was the criterion for picking out the major groups being discussed in the paper? My (limited) understanding is that the earliest prokaryotes, potentially including LUCA, LBCA and LACA, was likely marine, in the sense that there would not yet have been any land above sea level at such times. This might merit discussion in the paper. Might there have been earlier exclusively marine groups that went extinct at some point?
Thank you for pointing this out - this is a very interesting idea.
Firstly, the major marine lineages that we study here have largely already been defined in previous studies and are known to account for a large fraction of the total diversity and biomass of prokaryotes in the ocean. For example, Giovannoni and Stingl described most of these groups previously when discussing cosmopolitan and abundant marine lineages (Giovannoni and Stingl, 2005). The main criteria to select the marine clades studied here are (1) these groups have large impacts in the marine biogeochemical cycles and represent a large fraction of the microbial biomass in the open ocean, (2) they have an appropriate representation on genomic databases such that they can be confidently included in a phylogenetic tree, (3) the clades included can be confidently classified as being marine, in the sense that consequently the last common ancestor had a marine origin. This is explained in lines 83-86. We were primarily interested in lineages that encompassed a broad phylogenetic breadth, and we therefore did not include many groups that can be found in the ocean but are also readily isolated from a range of other environments (i.e., Pseudomonas spp., some Actinomycetes, etc.).
We agree that some of the earlier microbial branches in the Tree of Life were likely marine. The study of the marine origin of LUCA, LBCA, LACA, although interesting, is out of the scope of our study, and our results cannot offer any direct evidence of their habitat. We have therefore sought to focus on the origins of extant marine lineages.
What do the stochastic mapping analyses indicate about the respective ancestors of Gracilicutes and Terrabacteria? At least in the latter case, the original hypothesis for the group was that they possessed adaptations to life on land - which seems connected/relevant to the idea of radiating into the sea discussed here - so it might be interesting to discuss what your analyses say about that idea.
Thank you for your recommendation to perform additional analysis regarding the characterization of the ancestor of the superphyla Gracilicutes and Terrabacteria. We agree that this analysis would be very interesting, but we wish to focus the manuscript primarily on the marine clades in question, and other supergroups are listed in Figure 2 mainly for context. However, we did check the results of the stochastic mapping analysis and we now report the list of genes predicted to be gained and lost at the ancestor of the Gracilicutes and Terrabacteria clades, however; it is out of the scope of this study.
I very much appreciate that finding time calibrations for microbes is challenging, but I nonetheless have a couple of comments or concerns about the calibrations used here:
The minimum age for LBCA and LACA (Nodes 1 and 2 in Fig. 1) was calibrated with the earliest evidence of biogenic methane ~3.4Ga. In the case of LACA, I suppose this reflects the view that LACA was a methanogen, which is certainly plausible although perhaps not established with certainty. However, I'm less clear about the logic of calibrating the minimum age of Bacteria using this evidence, as I am not aware that there is much evidence that LBCA was a methanogen. Perhaps the line of reasoning here could be stated more explicitly. An alternative, slightly younger minimum age for Bacteria could perhaps be obtained from isotope data ~3.2Ga consistent with Cyanobacteria (e.g., see https://pubmed.ncbi.nlm.nih.gov/30127539/).
Thank you for pointing this out. We used the presence of methane as a minimum for life on Earth, not as a minimum for methanogenesis. Despite using this calibration as a minimum for the root of Bacteria and not having methanogenic representatives within this domain, there are independent lines of evidence that point to the presence of microbial life around the same time (~3.5 Ga, for example stromatolites from the Dresser Formation, Pilbara, Western Australia (~3.5 Ga) (Djokic et al., 2017; Walter et al., 1980; Buick and Dunlop, 1990)), and more recently (Hickman-Lewis et al., 2022). We added a rationale for the use of the evidence of methane as a minimum age for life on Earth to the manuscript (Table 1 and 100104).
I am also unclear about the rationale for setting the minimum age of the photosynthetic Cyanobacteria crown to the time of the GOE. Presumably, oxygen-generating photosynthesis evolved on the stem of (photosynthetic) Cyanobacteria, and it therefore seems possible that the GOE might have been initiated by these stem Cyanobacteria, with the crown radiating later? My confusion here might be a comprehension error on my part - it is possible that in fact one node "deeper" than the crown was being calibrated here, which was not entirely clear to me from Figure 1. Perhaps mapping the node numbers directly to the node, rather than a connected branch, would help? (I am assuming, based on nodes 1 and 2, that the labels are being placed on the branch directly antecedent to the node of interest)?
Thank you so much for your suggestion. As pointed out, the calibrations used were applied at the crown node of existing Cyanobacterial clades, not at the stem of photosynthetic Cyanobacteria. We agree that photosynthesis and therefore the production of molecular oxygen may have been present in more ancient Cyanobacterial clades, however; these groups have not been discovered yet or went extinct. We have improved Fig. 1 to avoid confusion and now it is part of the updated version of our manuscript.
Alleon J, Summons RE. 2019. Organic geochemical approaches to understanding early life. Free Radic Biol Med 140:103–112.
Buick R, Dunlop JSR. 1990. Evaporitic sediments of Early Archaean age from the Warrawoona Group, North Pole, Western Australia. Sedimentology 37: 247-277.
Creevey CJ, Doerks T, Fitzpatrick DA, Raes J, Bork P. 2011. Universally distributed single-copy genes indicate a constant rate of horizontal transfer. PLoS One 6:e22099.
Djokic T, Van Kranendonk MJ, Campbell KA, Walter MR, Ward CR. 2017. Earliest signs of life on land preserved in ca. 3.5 Ga hot spring deposits. Nat Commun 8:15263.
Giovannoni SJ, Stingl U. 2005. Molecular diversity and ecology of microbial plankton. Nature 437: 343-348.Hickman-Lewis K, Cavalazzi B, Giannoukos K, D'Amico L, Vrbaski S, Saccomano G, et al. 2023. Advanced two-and three-dimensional insights into Earth's oldest stromatolites (ca. 3.5 Ga): Prospects for the search for life on Mars. Geology 51: 33-38.
Lollar BS, McCollom TM. 2006. Geochemistry: biosignatures and abiotic constraints on early life. Nature.Martinez-Gutierrez CA, Aylward FO. 2021. Phylogenetic Signal, Congruence, and Uncertainty across Bacteria and Archaea. Mol Biol Evol 38:5514–5527.
Ren M, Feng X, Huang Y, Wang H, Hu Z, Clingenpeel S, Swan BK, Fonseca MM, Posada D, Stepanauskas R, Hollibaugh JT, Foster PG, Woyke T, Luo H. 2019. Phylogenomics suggests oxygen availability as a driving force in Thaumarchaeota evolution. ISME J 13:2150–2161.
Walter M R, R Buick, JSR Dunlop. 1980. Stromatolites 3,400–3,500 Myr old from the North pole area, Western Australia. Nature 284: 443-445.
Wu M, Scott AJ. 2012. Phylogenomic analysis of bacterial and archaeal sequences with AMPHORA2. Bioinformatics 28:1033–1034.
Yang Y, Zhang C, Lenton TM, Yan X, Zhu M, Zhou M, Tao J, Phelps TJ, Cao Z. 2021. The Evolution Pathway of Ammonia-Oxidizing Archaea Shaped by Major Geological Events. Mol Biol Evol 38:3637–3648.
https://doi.org/10.7554/eLife.88268.3.sa3Article and author information
Author details
Carolina A Martinez-Gutierrez

Funding
National Science Foundation (IIBR-2141862)
- Frank O Aylward
Simons Foundation (Early Career Award in Marine Microbial Ecology and Evolution)
- Frank O Aylward
The funders had no role in study design, data collection and interpretation, or the decision to submit the work for publication.
Acknowledgements
We acknowledge the use of the Virginia Tech Advanced Research Computing Center for bioinformatic analyses performed in this study. This investigation was supported by grants from the National Science Foundation (IIBR-2141862) and a Simons Foundation Early Career Award in Marine Microbial Ecology and Evolution to FOA. We kindly thank members of the Aylward Lab for their insightful comments on an earlier version of this manuscript.
Senior Editor
- George H Perry, Pennsylvania State University, United States
Reviewing Editor
- John McCutcheon, Arizona State University, United States
Version history
- Preprint posted: April 2, 2023 (view preprint)
- Sent for peer review: April 10, 2023
- Preprint posted: June 6, 2023 (view preprint)
- Preprint posted: October 30, 2023 (view preprint)
- Version of Record published: December 7, 2023 (version 1)
Cite all versions
You can cite all versions using the DOI https://doi.org/10.7554/eLife.88268. This DOI represents all versions, and will always resolve to the latest one.
Copyright
© 2023, Martinez-Gutierrez et al.
This article is distributed under the terms of the Creative Commons Attribution License, which permits unrestricted use and redistribution provided that the original author and source are credited.
Metrics
-
- 281
- Page views
-
- 35
- Downloads
-
- 0
- Citations
Article citation count generated by polling the highest count across the following sources: Crossref, PubMed Central, Scopus.
Download links
A two-part list of links to download the article, or parts of the article, in various formats.
Downloads (link to download the article as PDF)
Open citations (links to open the citations from this article in various online reference manager services)
Cite this article (links to download the citations from this article in formats compatible with various reference manager tools)
A timeline of bacterial and archaeal diversification in the ocean
eLife 12:RP88268.
https://doi.org/10.7554/eLife.88268.3
Further reading
-
- Evolutionary Biology
- Genetics and Genomics
In many species, meiotic recombination events tend to occur in narrow intervals of the genome, known as hotspots. In humans and mice, double strand break (DSB) hotspot locations are determined by the DNA-binding specificity of the zinc finger array of the PRDM9 protein, which is rapidly evolving at residues in contact with DNA. Previous models explained this rapid evolution in terms of the need to restore PRDM9 binding sites lost to gene conversion over time, under the assumption that more PRDM9 binding always leads to more DSBs. This assumption, however, does not align with current evidence. Recent experimental work indicates that PRDM9 binding on both homologs facilitates DSB repair, and that the absence of sufficient symmetric binding disrupts meiosis. We therefore consider an alternative hypothesis: that rapid PRDM9 evolution is driven by the need to restore symmetric binding because of its role in coupling DSB formation and efficient repair. To this end, we model the evolution of PRDM9 from first principles: from its binding dynamics to the population genetic processes that govern the evolution of the zinc finger array and its binding sites. We show that the loss of a small number of strong binding sites leads to the use of a greater number of weaker ones, resulting in a sharp reduction in symmetric binding and favoring new PRDM9 alleles that restore the use of a smaller set of strong binding sites. This decrease, in turn, drives rapid PRDM9 evolutionary turnover. Our results therefore suggest that the advantage of new PRDM9 alleles is in limiting the number of binding sites used effectively, rather than in increasing net PRDM9 binding. By extension, our model suggests that the evolutionary advantage of hotspots may have been to increase the efficiency of DSB repair and/or homolog pairing.
-
- Evolutionary Biology
- Microbiology and Infectious Disease
Drug resistance remains a major obstacle to malaria control and eradication efforts, necessitating the development of novel therapeutic strategies to treat this disease. Drug combinations based on collateral sensitivity, wherein resistance to one drug causes increased sensitivity to the partner drug, have been proposed as an evolutionary strategy to suppress the emergence of resistance in pathogen populations. In this study, we explore collateral sensitivity between compounds targeting the Plasmodium dihydroorotate dehydrogenase (DHODH). We profiled the cross-resistance and collateral sensitivity phenotypes of several DHODH mutant lines to a diverse panel of DHODH inhibitors. We focus on one compound, TCMDC-125334, which was active against all mutant lines tested, including the DHODH C276Y line, which arose in selections with the clinical candidate DSM265. In six selections with TCMDC-125334, the most common mechanism of resistance to this compound was copy number variation of the dhodh locus, although we did identify one mutation, DHODH I263S, which conferred resistance to TCMDC-125334 but not DSM265. We found that selection of the DHODH C276Y mutant with TCMDC-125334 yielded additional genetic changes in the dhodh locus. These double mutant parasites exhibited decreased sensitivity to TCMDC-125334 and were highly resistant to DSM265. Finally, we tested whether collateral sensitivity could be exploited to suppress the emergence of resistance in the context of combination treatment by exposing wildtype parasites to both DSM265 and TCMDC-125334 simultaneously. This selected for parasites with a DHODH V532A mutation which were cross-resistant to both compounds and were as fit as the wildtype parent in vitro. The emergence of these cross-resistant, evolutionarily fit parasites highlights the mutational flexibility of the DHODH enzyme.


