Competing neural representations of choice shape evidence accumulation in humans
- Department of Psychology, Carnegie Mellon University, United States
- Center for the Neural Basis of Cognition, United States
- Carnegie Mellon Neuroscience Institute, United States
- Department of Biomedical and Health Informatics, University of Washington, United States
- Department of Mathematics, University of Pittsburgh, United States
- Department of Biomedical Engineering, Carnegie Mellon University, United States
Abstract
Making adaptive choices in dynamic environments requires flexible decision policies. Previously, we showed how shifts in outcome contingency change the evidence accumulation process that determines decision policies. Using in silico experiments to generate predictions, here we show how the cortico-basal ganglia-thalamic (CBGT) circuits can feasibly implement shifts in decision policies. When action contingencies change, dopaminergic plasticity redirects the balance of power, both within and between action representations, to divert the flow of evidence from one option to another. When competition between action representations is highest, the rate of evidence accumulation is the lowest. This prediction was validated in in vivo experiments on human participants, using fMRI, which showed that (1) evoked hemodynamic responses can reliably predict trial-wise choices and (2) competition between action representations, measured using a classifier model, tracked with changes in the rate of evidence accumulation. These results paint a holistic picture of how CBGT circuits manage and adapt the evidence accumulation process in mammals.
Editor's evaluation
This valuable study presents solid evidence for how change in reward contingency in the environment affects the dynamics of a realistic large-scale neural circuit model, human choice behavior, and fMRI responses. This study could be of interest to scientists studying the neural and computational bases of adaptive behavior.
https://doi.org/10.7554/eLife.85223.sa0Introduction
Choice is fundamentally driven by information. The process of deciding between available actions is continually updated using incoming sensory signals, processed at a given accumulation rate, until sufficient evidence is reached to trigger one action over another (Gold and Shadlen, 2007; Ratcliff, 1978). The parameters of this evidence accumulation process are highly plastic, adjusting to both the reliability of sensory signals (Nassar et al., 2010; Wilson and Niv, 2011; Nassar et al., 2012; Behrens et al., 2007; Bond et al., 2021) and previous choice history (Urai et al., 2019; Ratcliff and Frank, 2012; Pedersen et al., 2017; Dunovan and Verstynen, 2019; Dunovan et al., 2019; Mendonça et al., 2020), to balance the speed of a given decision with local demands to choose the correct action.
We recently showed how environmental changes influence the decision process by periodically switching the reward associated with a given action in a two-choice task (Bond et al., 2021). This reward contingency change induces competition between old and new action values, leading to a shift in preference toward the new most rewarding option. Internal competition prompts humans to dynamically reduce the rate at which they accumulate evidence (drift rate in a normative drift diffusion model [DDM]; Ratcliff, 1978) and sometimes also increases the threshold of evidence they need to trigger an action (boundary height). The result is a change of the decision policy to a slow, exploratory state. Over time feedback learning pushes the system back into an exploitative state until the environment changes again (see also Dunovan and Verstynen, 2019 and Dunovan et al., 2019).
Here we adopt a generative modeling approach to investigate the underlying neural mechanisms that drive dynamic decision policies in a changing environment. We start with a set of theoretical experiments, using biologically realistic spiking network models, to test how competition within the cortico-basal ganglia-thalamic (CBGT) circuits influences the evidence accumulation process (Dunovan and Verstynen, 2016; Bariselli et al., 2019; Mikhael and Bogacz, 2016; Rubin et al., 2021; Yartsev et al., 2018). Our choice of model, over simple abstracted network models (e.g., rate-based networks), reflects an approach designed to capture both microscale and macroscale dynamics, allowing for the same model to bridge observations across multiple levels of analysis (see also Noble et al., 2020; Schirner et al., 2018; Franklin and Frank, 2015). These theoretical experiments both explain previous results (Bond et al., 2021) and make specific predictions as to how competition between action representations drives changes in the decision policy. We then test these predictions in humans using a high-powered, within-participant neuroimaging design, collecting data over thousands of trials where action–outcome contingencies change on a semi-random basis.
Results
CBGT circuits can control decision parameters under uncertainty
Both theoretical (Bogacz and Gurney, 2007; Bogacz et al., 2010; Ratcliff and Frank, 2012; Dunovan and Verstynen, 2016; Dunovan et al., 2019; Vich et al., 2022) and experimental (Yartsev et al., 2018; Thura et al., 2022) evidence suggests that the CBGT circuits play a critical role in the evidence accumulation process (for a review, see Gupta et al., 2021). The canonical CBGT circuit (Figure 1A) includes two dissociable control pathways: the direct (facilitation) and indirect (suppression) pathways (Albin et al., 1995; Friend and Kravitz, 2014). A critical assumption of the canonical model is that the basal ganglia are organized into multiple ‘channels,’ mapped to specific action representations (Mink, 1996; Alexander et al., 1986), each containing a direct and indirect pathway. It is important to note that, for the sake of parsimony, we adopt a simple and canonical model of CBGT pathways, with action channels that are agnostic as to the location of representations (e.g., lateralization), simply assuming that actions have unique population-level representations. While a strict, segregated action channel organization may not accurately reflect the true underlying circuitry, striatal neurons have been shown to organize into task-specific spatiotemporal assemblies that qualitatively reflect independent action representations (Adler et al., 2013; Klaus et al., 2017; Barbera et al., 2016; Carrillo-Reid et al., 2011; Badreddine et al., 2022).
Figure 1 with 4 supplements see all
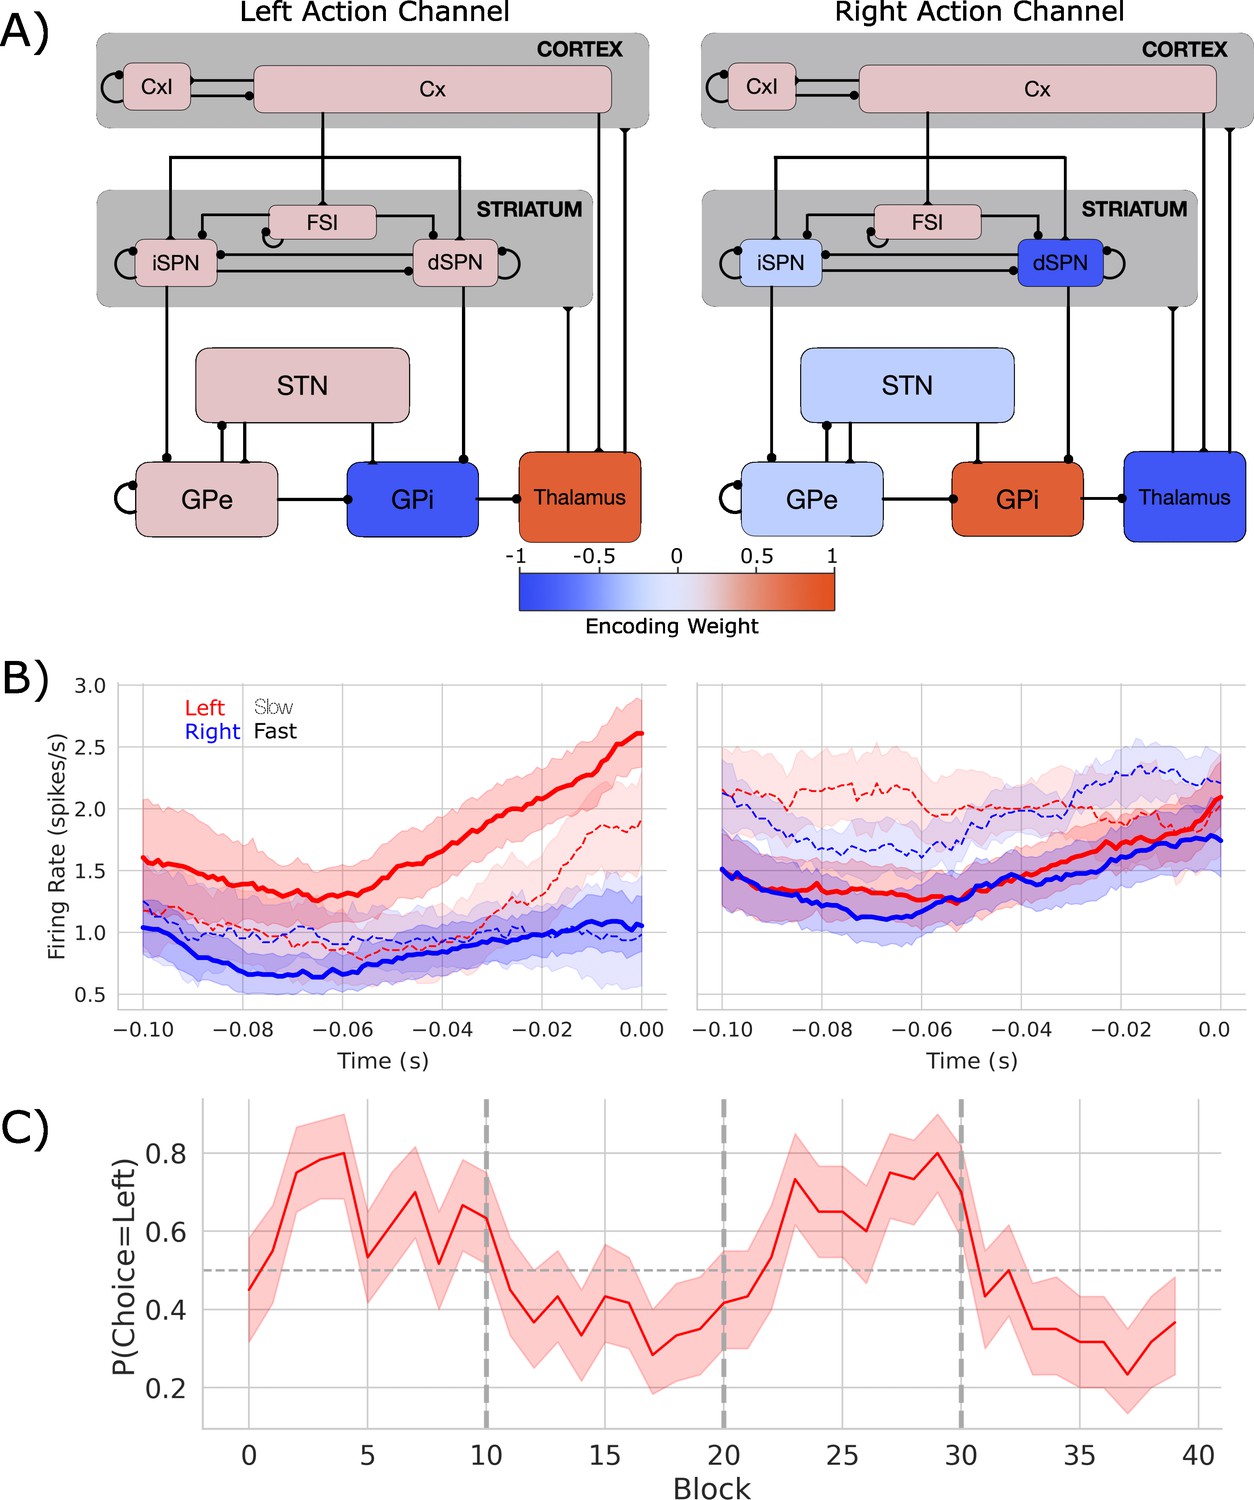
Biologically based cortico-basal ganglia-thalamic (CBGT) network dynamics and behavior.
(A) Each CBGT nucleus is organized into left and right action channels with the exception of a common population of striatal fast spiking interneurons (FSIs) and cortical interneurons (CxI). Values show encoded weights for left and right action channels when a left action is made. Network schematic adapted from Figure 1 of Vich et al., 2022. (B) Firing rate profiles for dSPNs (left panel) and iSPNs (right panel) prior to stimulus onset (t = 0) for a left choice. SPN activity in left and right action channels is shown in red and blue, respectively. Slow and fast decisions are shown with dashed and solid lines, respectively. (C) Choice probability for the CBGT network model. The reward for left and right actions changed every 10 trials, marked by vertical dashed lines. The horizontal dashed line represents chance performance.
Within these action channels, activation of the direct pathway, via cortical excitation of D1-expressing spiny projection neurons (SPNs) in the striatum, releases GABAergic signals that can suppress activity in the CBGT output nucleus (internal segment of the globus pallidus, GPi, in primates or substantia nigra pars reticulata, SNr, in rodents) (Kravitz et al., 2012; Gurney et al., 2001; Alexander et al., 1986; Mink, 1996). This relieves the thalamus from tonic inhibition, thereby exciting postsynaptic cortical cells and facilitating action execution. Conversely, activation of the indirect pathway via D2-expressing SPNs in the striatum controls firing in the external segment of the globus pallidus (GPe) and the subthalamic nucleus (STN), resulting in strengthened basal ganglia inhibition of the thalamus. This weakens drive to postsynaptic cortical cells and reduces the likelihood that an action is selected in cortex.
Critically, the direct and indirect pathways converge in the GPi/SNr (Kitano et al., 1998; Foster et al., 2021). This suggests that these pathways compete to control whether each specific action is selected (Dunovan et al., 2015). The apparent winner-take-all selection policy and action-channel like coding (Adler et al., 2013; Klaus et al., 2017; Barbera et al., 2016; Carrillo-Reid et al., 2011; Badreddine et al., 2022) also imply that action representations themselves compete. Altogether, this neuroanatomical evidence suggests that competition both between and within CBGT pathways control the rate of evidence accumulation during decision-making (Dunovan et al., 2019; Bariselli et al., 2019; Vich et al., 2022).
To simulate this process, we designed a spiking neural network model of the CBGT circuits, shown in Figure 1A, with dopamine-dependent plasticity occurring at the corticostriatal synapses (Vich et al., 2020; Rubin et al., 2021). Critically, although this model simulates dynamics that happen on a microscale, it can be mapped upward to infer macroscale properties, like inter-region dynamics and complex behavior, making it a useful theoretical tool for bridging across levels of analysis. The network performed a probabilistic two-arm bandit task with switching reward contingencies (see Figure 3—figure supplement 1) that followed the same general structure as our prior work (Bond et al., 2021), with the exception that block switches were deterministic for the model, happening every 10 trials, whereas in actual experiments they are generated probabilistically so as to increase the uncertainty of participant expectations of the timing of outcome switches. In brief, the network selected one of two targets, each of which returned a reward according to a specific probability distribution. The relative reward probabilities for each target were held constant at 75 and 25% and the action–outcome contingency was changed every 10 trials, on average. For the purpose of this study, we focus primarily on the neural and behavioral effects associated with a switch in the identity of the optimal target. We used four different network instances (see Supp. Methods) as a proxy for simulating individual differences over human participants.
Figure 1B shows the firing rates of dSPNs and iSPNs in the left action channel, time-locked to selection onset (when thalamic units exceed 30 Hz, t = 0), for both fast (<196 ms) and slow (>314.5 ms) decisions (see Figure 1—figure supplement 1 for node-by-node firing-rates). As expected, the dSPNs show a ramping of activity as decision onset is approached and the slope of this ramp scales with response speed. In contrast, we see that iSPN firing is sustained during slow movements and weakly ramps during fast movements. However, iSPN firing was relatively insensitive to left versus right decisions. This is consistent with our previous work showing that differences in direct pathways track primarily with choice while indirect pathway activity modulates overall response speeds (Dunovan et al., 2019; Vich et al., 2022) as supported by experimental studies (Yttri and Dudman, 2016; Forstmann et al., 2010; Maia and Frank, 2011).
We then modeled the behavior of the CBGT network using a hierarchical version of the DDM (Wiecki et al., 2013), a canonical formalism for the process of evidence accumulation during decision-making (Ratcliff, 1978; Figure 2A). This model returns four key parameters with distinct influences on evidence accumulation. The drift rate () represents the rate of evidence accumulation, the boundary height () represents the amount of evidence required to cross the decision threshold, nondecision time () is the delay in the onset of the accumulation process, and starting bias () is a bias to begin accumulating evidence for one choice over another (see ‘Materials and methods’ section).
Figure 2 with 1 supplement see all
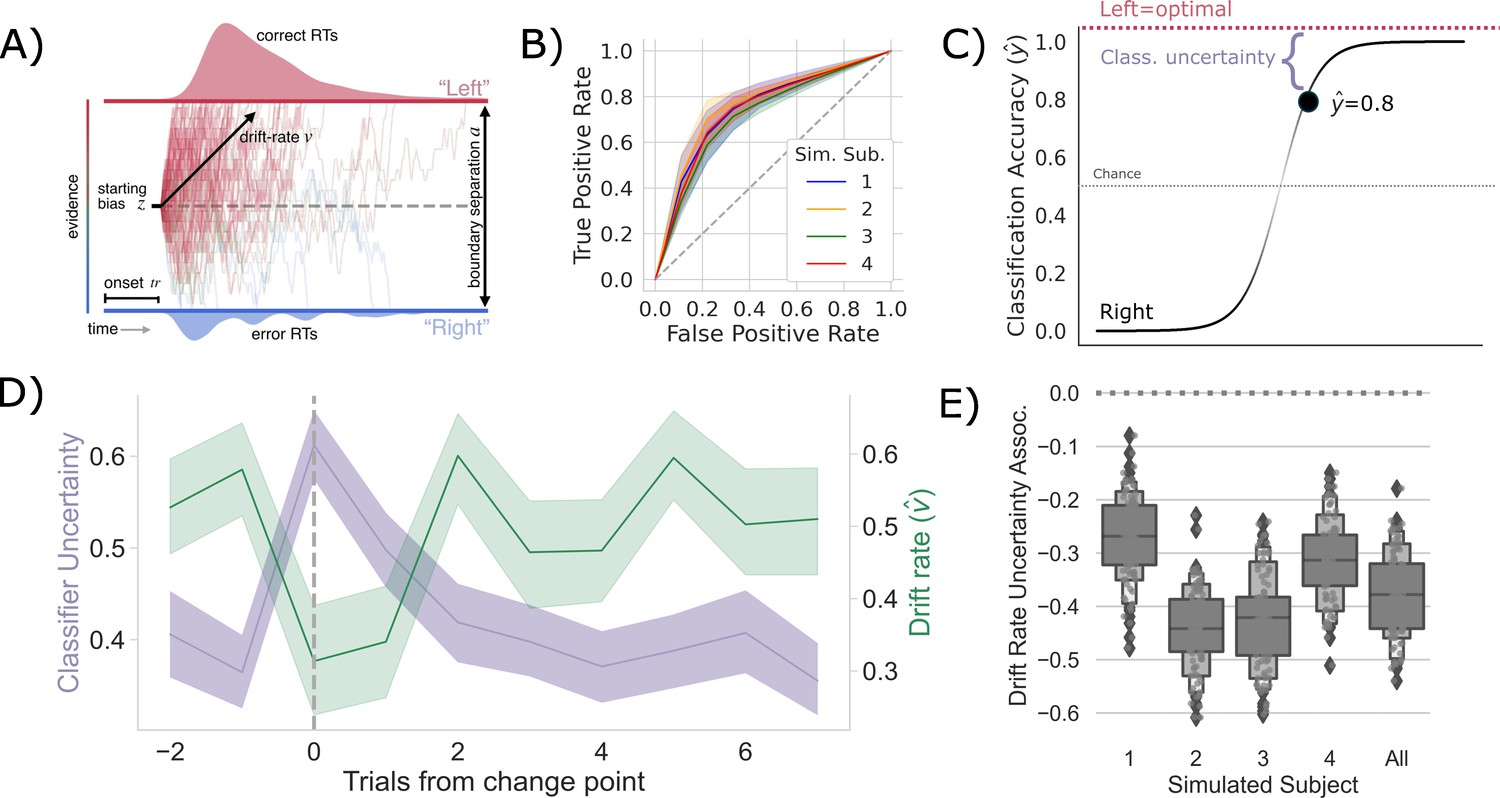
Competition between action plans should drive evidence accumulation.
(A) Decision parameters were estimated by modeling the joint distribution of reaction times and responses within a drift diffusion framework. (B) Classification performance for single-trial left and right actions shown as an Receiver Operating Characteristic (ROC) curve. The gray dashed line represents chance performance. (C) Predicted left and right responses. The distance of the predicted response from the optimal choice represents uncertainty for each trial. For example, here the predicted probability of a left response on the first trial is 0.8. The distance from the optimal choice on this trial and, thereby, the uncertainty , is 0.2. (D) Change point-evoked uncertainty (lavender) and drift rate (green). The change point is marked by a dashed line. (E) Bootstrapped estimates of the association between uncertainty and drift rate. Results for individual participants are presented along with aggregated results.
We tracked internal estimates of action-value and environmental change using trial-by-trial estimates of two ideal observer parameters, the belief in the value of the optimal choice () and change point probability (), respectively (see Bond et al., 2021; Nassar et al., 2010 and ‘Materials and methods’ for details). Using these estimates, we evaluated how a suspected change in the environment and the belief in optimal choice value influenced underlying decision parameters. Consistent with prior observations in humans (Bond et al., 2021), we found that both and were the most pliable parameters across experimental conditions for the network. Specifically, we found that the model mapping to drift rate and to boundary height and the model relating to drift rate provided equivocal best fits to the data over human participants ( and , respectively; see Burnham and Anderson, 1998 and ‘Materials and methods’ for guidelines on model fit interpretation). All other models failed to provide a better fit than the null model (Supplementary file 1). Consistent with prior work (Bond et al., 2021), we found that the relationship between and the boundary height was unreliable (mean ; mean ). However, drift rate reliably increased with in three of four participants (mean ; mean p<0.001 participants p<0.001; Supplementary file 2).
These effects reflect a stereotyped trajectory around a change point, whereby immediately plummets and briefly increases, with quickly recovering and slowly growing as reward feedback reinforces the new optimal target (Bond et al., 2021). Because prior work has shown that the change in is more reliable than changes in (Bond et al., 2021) and because determines the direction of choice, we focus the remainder of our analysis on the control of .
To test whether these shifts in are driven by competition within and between action channels, we predicted the network’s decision on each trial using a LASSO-PCR trained on the pre-decision firing rates of the network (see ‘Measuring neural action representations’). The choice of LASSO-PCR was based on prior work building reliable classifiers from whole-brain-evoked responses that maximize inferential utility (see Meissner et al., 2011). The method is used when models are over-parameterized, as when there are more voxels than observations, relying on a combination of dimensionality reduction and sparsity constraints to find the true, effective complexity of a given model. While these are not considerations with our network model, they are with the human validation experiment that we describe next. Thus, we used the same classifier on our model as on our human participants to directly compare theoretical predictions and empirical observations. Model performance was cross-validated at the run level using a leave-one-run-out procedure, resulting in 45 folds per subject (five runs for each of the nine sessions). We then classified all trials in the hold-out set to evaluate prediction accuracy. The cross-validated accuracy for the four models, simulating individual participants, is shown in Figure 2B as ROC curves. The classifier was able to predict the chosen action with approximately 75% accuracy (72–80%) for each simulated participant, with an average area under the curve (AUC) of approximately 0.75, ranging from 0.71 to 0.77.
Examining the encoding pattern in the simulated network, we see lateralized activation over left and right action channels (Figure 1A), with opposing weights in GPi and thalamus, and, to a lesser degree, contralateral encoding in STN and in both indirect and direct SPNs in striatum. We do not observe contralateral encoding in cortex, which likely reflects the emphasis on basal ganglia structures and lumped representation of cortex in the model design.
To quantify the competition between action channels, we took the unthresholded prediction from the LASSO-PCR classifier, , and calculated its distance from the optimal target (i.e., target with the highest reward probability) on each trial (Figure 2C). This provided an estimate of the uncertainty driven by the separability of pre-decision activity across action channels. In other words, the distance from the optimal target should increase with increased co-activation of circuits that represent opposing actions. The decision to model aggregate trial dynamics with a classifier stems from the limitations of the hemodynamic response that we will use next to vet the model predictions in humans. The low temporal resolution of the evoked BOLD signal makes finer-grained temporal analysis for the human data impossible as the signal is a low-pass filtered version of the aggregate response over the entire trial. So, we chose to represent the macroscopic network dynamics as classifier uncertainty, which cleanly links the cognitive model results to both behavior and neural dynamics at the trial-by-trial level using only two variables (drift rate and classifier uncertainty). This approach allows us to directly compare model and human results.
If the competition in action channels is also driving , then there should be a negative correlation between the classifier’s uncertainty and , particularly around a change point. Indeed, this is exactly what we see (Figure 2D). In fact, the uncertainty and are consistently negatively correlated across all trials in every simulated participant and in aggregate (Figure 2E). Thus, in our model of the CBGT pathways, competition between action representations drives changes in in response to environmental change.
Next, in order to rule out the possibility that these adaptive network effects emerged due to the specific parameter scheme that we used for the simulations, we re-ran our simulations using different parameter schemes. For this, we used a constrained sampling procedure (see Vich et al., 2022) to sample a range of different networks with varying degrees of speed and accuracy. This parameter search was constrained to permit regimes that result in biologically realistic firing rates (Figure 1—figure supplement 1). The simulations above arose from a parameter scheme lying in the middle of this response speed distribution (intermediate). We then chose two parameter regimes, one that produces response speeds in the upper quartile of the distribution (slow) and one that produces response speeds in the lower quartile (fast; Figure 1—figure supplement 2A and B). We repeated the simulation experiments with these new more ‘extreme’ networks. As expected, our general classifier accuracy held across the range of regimes, with comparable performance across all three model types (Figure 1—figure supplement 2C). In addition, the reciprocal relationship between classifier uncertainty and were replicated in the fast and slow networks (Figure 2—figure supplement 1A), with the fast network showing a more expansive dynamic range of drift rates than the intermediate or slow networks. When we look at the correlation between classifier uncertainty and , we again see a consistent negative association across parameter regimes (Figure 2—figure supplement 1B). The variability of this effect increases when networks have faster response times, suggesting that certain parameter regimes increase overall behavioral variability. Despite this, our key simulation effects appear to be robust to variation in parameter scheme.
Humans adapt decision policies in response to change
To test the predictions of our model, a sample of humans (N = 4) played a dynamic two-armed bandit task under experimental conditions similar to those used for the simulated CBGT network and prior behavioral work (Bond et al., 2021) as whole brain hemophysiological signals were recorded using functional magnetic resonance imaging (fMRI) (Figure 3—figure supplement 1). On each trial, participants were presented with a male and female Greeble (Gauthier and Tarr, 1997). The goal was to select the Greeble most likely to give a reward. Selections were made by pressing a button with their left or right hand to indicate the left or right Greeble on the screen.
Crucially, we designed this experiment such that each participant acted as an out-of-set replication test, having performed thousands of trials individually. Specifically, to ensure we had the statistical power to detect effects on a participant-by-participant basis, we collected an extensive data set comprising 2700 trials over 45 runs from nine separate imaging sessions for each of four participants. Consequently, we amassed a grand total of 36 hr of imaging data over all participants, which was used to evaluate the replicability of our findings at the participant-by-participant level. Therefore, our statistical analyses were able to estimate effects on a single-participant basis.
Behaviorally, human performance in the task replicated our prior work (Bond et al., 2021). Both response speed and accuracy changed across conditions in a way that matched what we observed in Experiment 2 in Bond et al., 2021. Specifically, we see a consistent effect of change point on both RT and accuracy that matches the behavior of our network (Figure 3—figure supplement 2). To address how a change in the environment shifted underlying decision dynamics, we used a hierarchical DDM modeling approach (Wiecki et al., 2013) as we did with the network behavior (see ‘Materials and methods’ for details). Given previous empirical work (Bond et al., 2021) and the results from our CBGT network model showing that only and, less reliably, respond to a shift in the environment, we focused our subsequent analysis on these two parameters. We compared models where single parameters changed in response to a switch, pairwise models where both parameters changed, and a null model that predicts no change in decision policy (Supplementary files 1 and 2). Consistent with the predictions from our CBGT model, we found equivocal fits for the model mapping both to and to and a simpler model mapping to (see Supplementary file 1 for average results). This pattern was fairly consistent at the participant level, with 3/4 participants showing modulating (Supplementary file 2). These results suggest that as the belief in the value of the optimal choice approaches the reward value for the optimal choice, the rate of evidence accumulation increases.
Taken altogether, we confirm that humans rapidly shift how quickly they accumulate evidence (and, to some degree, how much evidence they need to make a decision) in response to a change in action–outcome contingencies. This mirrors the decision parameter dynamics predicted by the CBGT model. We next evaluated how this change in decision policy tracks with competition in neural action representations.
Measuring action representations in the brain
To measure competition in action representations, we first needed to determine how individual regions (i.e., voxels) contribute to single decisions. For each participant, trial-wise responses at every voxel were estimated by means of a general linear model (GLM), with trial modeled as a separate condition in the design matrix. Therefore, the estimated at voxel reflected the magnitude of the evoked response on trial . As in the CBGT model analysis, these whole-brain, single-trial responses were then submitted to a LASSO-PCR classifier to predict left/right response choices (Figure 3—figure supplement 3). The performance of the classifier for each participant was evaluated with a 45-fold cross-validation, iterating through all runs so that each one corresponded to the hold-out test set for one fold.
Our classifier was able to predict single-trial responses well above chance for each of the four participants (Figure 3A and B), with mean prediction accuracy ranging from 65 to 83% (AUCs from 0.72 to 0.92). Thus, as with the CBGT network model, we were able to reliably predict trial-wise responses for each participant. Figure 3C shows the average encoding map for our model as an illustration of the influence of each voxel on our model predictions (Figure 3—figure supplement 4 displays individual participant maps). These maps effectively show voxel-tuning toward rightward (blue) or leftward (red) responses. Qualitatively, we see that cortex, striatum, and thalamus all exhibit strongly lateralized influences on contralateral response prediction. Indeed, when we average the encoding weights in terms of principal CBGT nuclei (Figure 3D), we confirm that these three regions largely predict contralateral responses. See Figure 3—figure supplement 4 for a more detailed summary of the encoding weights across multiple cortical and subcortical regions.
Figure 3 with 4 supplements see all
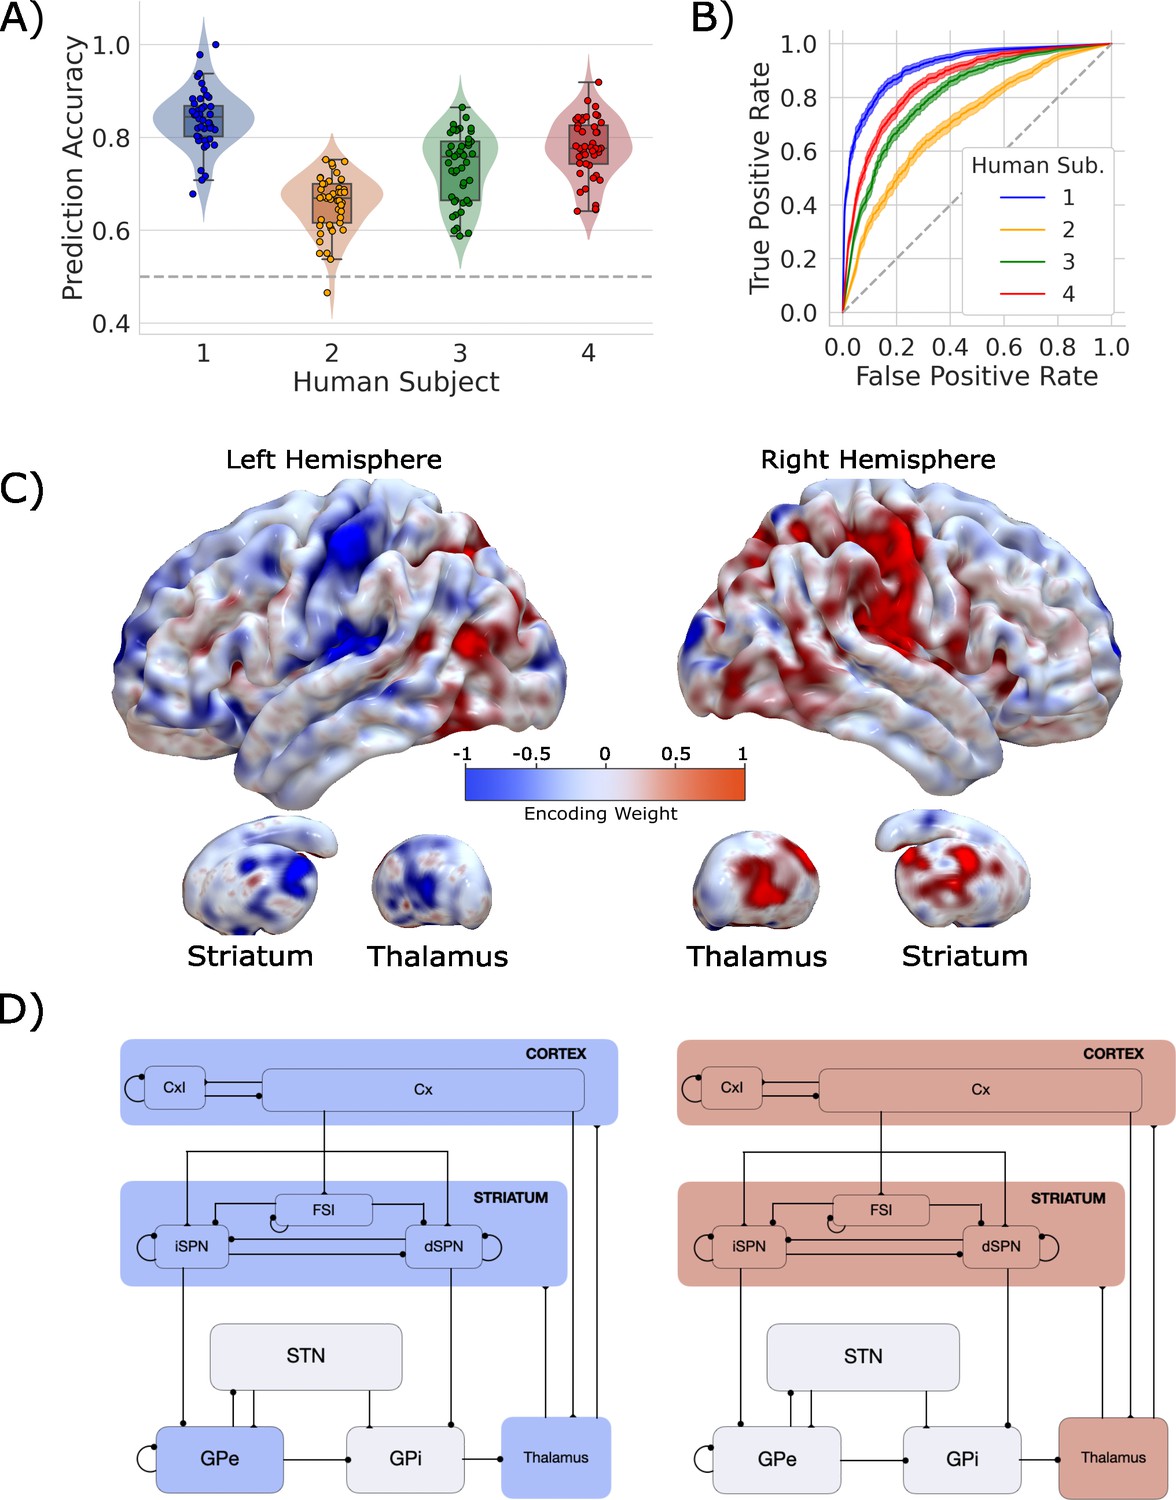
Single-trial prediction of action plan competition in humans.
(A) Overall classification accuracy for single-trial actions for each participant. Each point corresponds to the performance for each of the 45 folds in our leave-one-run-out cross-validation procedure. (B) Classification performance for single-trial actions shown as an ROC curve. The gray dashed line represents chance performance. (C) Participant-averaged encoding weight maps in standard space for both hemispheres. (D) The mean encoding weights within each cortico-basal ganglia-thalamic (CBGT) node in both hemispheres. See encoding weight scale above for reference.
These results show that we can reliably predict single-trial choices from whole-brain hemodynamic responses for individual participants. Further, key regions of the CBGT pathway contribute to these predictions. Next, we set out to determine whether competition between these representations for left and right actions correlates with changes in the drift rate, as predicted by the CBGT network model (Figure 2C).
Competition between action representations may drive drift rate
To evaluate whether competition between action channels correlates with the magnitude of on each trial, as the CBGT network predicts (Figure 2C), we focused our analysis on trials surrounding the change point, following analytical methods identical to those described in the previous section and shown in Figure 2C.
Consistent with the CBGT network model predictions, following a change point, shows a stereotyped drop and recovery as observed in the CBGT network (Figure 2C) and prior behavioral work (Bond et al., 2021; Figure 4A). This drop in tracked with a relative increase in classifier uncertainty, and subsequent recovery, in response to a change in action–outcome contingencies (mean bootstrapped to range: to , , ). As with the CBGT network simulations (Figure 2D), we also observe a consistent negative correlation between and classifier uncertainty over all trials, irrespective of their position to a change point, in each participant and in aggregate (Figure 4B; Spearman’s range: to range: to 0.043, see Figure 4—figure supplement 1 for null effect on ).
Figure 4 with 1 supplement see all
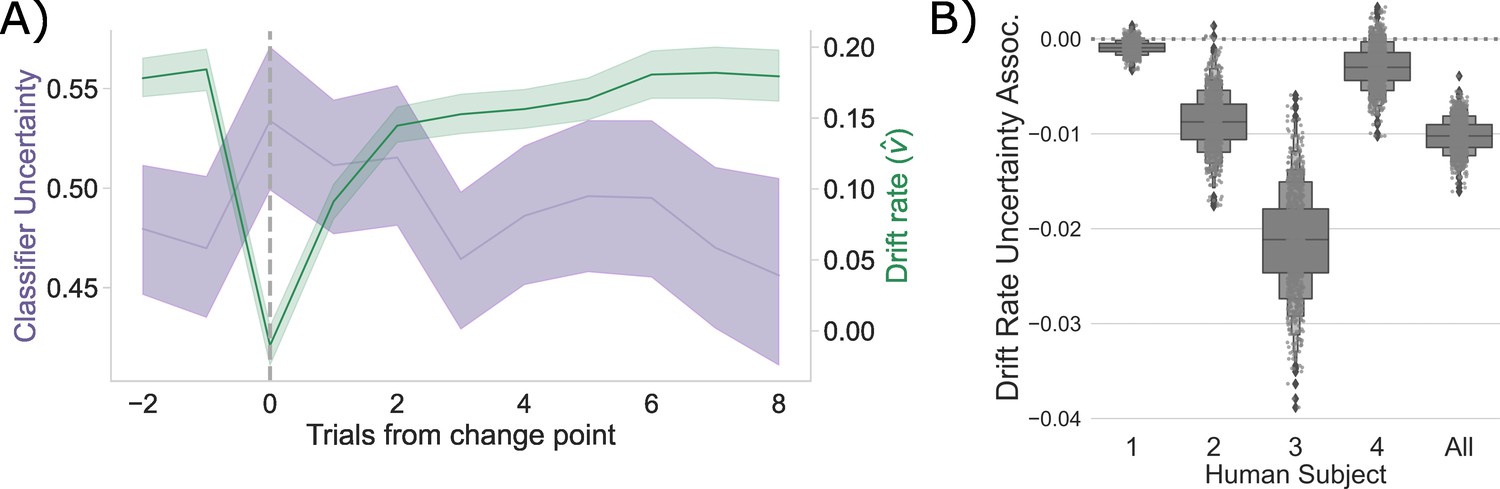
Competition between action plans drives evidence accumulation in humans.
(A) Classifier uncertainty (lavender) and estimated drift rate (; green) dynamics. (B) Bootstrapped estimate of the association between classifier uncertainty and drift rate by participant and in aggregate.
These results clearly suggest that, as predicted by our CBGT network simulations and prior work (Dunovan et al., 2019; Vich et al., 2022; Rubin et al., 2021), competition between action representations drives changes in the rate of evidence accumulation during decision-making in humans.
Discussion
Here we investigated the underlying mechanisms that drive shifts in decision policies when the rules of the environment change. We first tested an implementation-level theory of how CBGT networks contribute to changes in decision policy parameters using a modeling approach that allows us to bridge across levels of analysis. This theory predicted that the rate of evidence accumulation is driven by competition across action representations. Using a high-powered, within-participants fMRI design, where each participant served as an independent replication test, we found evidence consistent with our CBGT network simulations. Specifically, as action–outcome contingencies change, thereby increasing uncertainty in the optimal choice, decision policies shift with a rapid decrease in the rate of evidence accumulation, followed by a gradual recovery to baseline rates as new contingencies are learned (see also Bond et al., 2021). These results empirically validate prior theoretical and computational work predicting that competition between neural populations encoding distinct actions modulates how information is used to drive a decision (Bogacz and Gurney, 2007; Bogacz et al., 2010; Ratcliff and Frank, 2012; Dunovan and Verstynen, 2016; Dunovan et al., 2019).
Our findings here align with prior work on the role of competition in the regulation of evidence accumulation. In the decision-making context, the ratio of dSPN to iSPN activation within an action channel has been linked to the drift rate of single-action decisions (Dunovan et al., 2015; Dunovan and Verstynen, 2016; Bariselli et al., 2019; Mikhael and Bogacz, 2016). In the motor control context, this competition manifests as movement vigor (Yttri and Dudman, 2016; Dudman and Krakauer, 2016; Turner and Desmurget, 2010). Yet, our results show how competition across channels drives drift rate dynamics. So how do we reconcile these two effects? Mechanistically, the strength of each action channel is defined by the relative difference between dSPN and iSPN influence. In this way, competition across action channels is defined by the relative balance of direct and indirect pathway activation within each channel. Greater within-channel competition, relative to the competition in other channels, makes that action decision relatively slow and reduces the overall likelihood that it is selected. This mechanism is consistent with prior theoretical (Dunovan et al., 2019; Vich et al., 2022) and empirical work (Yartsev et al., 2018).
While our current work postulates a mechanism by which changes in action–outcome contingencies drive changes in evidence accumulation through plasticity within the CBGT circuits, the results presented here are far from conclusive. For example, our model of the underlying neural dynamics predicts that the certainty of individual action representations is encoded by the competition between direct and indirect pathways (see also Dunovan et al., 2019; Vich et al., 2020; Vich et al., 2022). Thus, external perturbation of dSPN (or iSPN) firing during decision-making, say using optogenetic stimulation, should causally impact the evidence accumulation rate and, subsequently, the speed at which the new action–outcome contingencies are learned. Indeed, there is already some evidence for this outcome (see Yartsev et al., 2018, but also Ding and Gold, 2010 for contrastive evidence).
Our model, however, has very specific predictions with regards to disruptions of each pathway within an action representation. Disrupting the balance of dSPN and iSPN efficacy should selectively impact the drift rate (and, to a degree, onset bias; see Vich et al., 2022), while non-specific disruption of global iSPN efficacy across action representations should selectively disrupt boundary height (and, to a degree, accumulation onset time; see again Vich et al., 2022). These are specific predictions that can be tested in follow-up studies.
Careful attention to the effect size of our correlations between channel competition and drift rate shows that the effect is substantially smaller in humans than in the model. This is not surprising due to several factors. Firstly, the simulated data is not affected by the same sources of noise as the hemodynamic signal, whose responses can be greatly influenced by factors such as the heterogeneity of cell populations and the properties of underlying neurovascular coupling. Additionally, our model is not susceptible to non-task-related variance, such as fatigue or lapses of attention, which the humans likely experienced. While we could have fine-tuned the model results based on the empirical human data, that would contaminate the independence of our predictions and defeat the purpose of using a generative model. With this in mind, we opted to focus on comparing the overall pattern of human and simulated results. Finally, our simulations only used a single experimental condition, whereas human experiments varied the relative value of options and the volatility of their value, which led to more variance in human responses. Nevertheless, despite these differences, we see qualitative similarities in both the model and human results, providing confirmation of a key aspect of our theory.
Looking at the overall pattern of results, we see that increasing the difference between dSPN and iSPN firing in the channel representing the new optimal-action should decrease the time needed to resolve the credit assignment problem during learning (Rubin et al., 2021). This would result in faster and more accurate learning in response to a change in the environment and lead to characteristic signatures in the distribution of reaction times, as well as choice probabilities, reflective of a shift in evidence accumulation rate. Of course, testing these predictions is left to future work.
It is important to point out that there are critical assumptions in our model that might impact how the results can be interpreted. For example, we are assuming a strict action channel organization of CBGT pathways (Mink, 1996). Realistically action representations in these networks are not as rigid, and there may be overlaps in these representations (see Klaus et al., 2017). However, by restricting our responses to fingers on opposite hands, it is reasonable to assume that the underlying CBGT networks that regulate selecting the two actions are largely independent. Another critical assumption of our model is the simple gating mechanism from the thalamus, where actions get triggered once thalamic firing crosses a specified threshold. In reality, the dynamics of thalamic gating are likely more complicated (Logiaco et al., 2021) and the nuance of this process could impact network behavior and subsequent predictions. Until the field has a better understanding of the process of gating actions, our simple threshold model, although incomplete, remains useful for generating simple behavioral predictions. These assumptions may limit some of the nuance of the predicted brain–behavior associations; however, they likely have little impact on the main prediction that competition in action representations tracks with the rate of evidence accumulation during decision-making.
Conclusion
As the world changes and certain actions become less optimal, successful behavioral adaptation requires flexibly changing how sensory evidence drives decisions. Our simulations and hemophysiological experiments in humans show how this process can occur within the CBGT circuits. Here, a shift in action–outcome contingencies induces competition between encoded action plans by modifying the relative balance of direct and indirect pathway activity in CBGT circuits, both within and between action channels, slowing the rate of evidence accumulation to promote adaptive exploration.
If the environment subsequently remains stable, then this learning process accelerates the rate of evidence accumulation for the optimal decision by increasing the strength of action representations for the new optimal choice. This highlights how these macroscopic systems promote flexible, effective decision-making under dynamic environmental conditions.
Materials and methods
Simulations
Request a detailed protocolWe simulated neural dynamics and behavior using a biologically based, spiking CBGT network model (Dunovan and Verstynen, 2019; Vich et al., 2022). The network representing the CBGT circuit is composed of nine neural populations: cortical interneurons (CxI), excitatory cortical neurons (Cx), striatal D1/D2-spiny projection neurons (dSPNs/iSPNs), striatal fast-spiking interneurons (FSI), the internal (GPi) and external globus pallidus (GPe), the subthalamic nucleus (STN), and the thalamus (Th). All the neuronal populations are segregated into two action channels with the exception of cortical (CxI) and striatal interneurons (FSIs). Each neuron in the population was modeled with an integrate-fire-or-burst-model (Wei et al., 2015), and a conductance-based synapse model was used for NMDA, AMPA, and GABA receptors. The neuronal and network parameters (inter-nuclei connectivity and synaptic strengths) were tuned to obtain realistic baseline firing rates for all the nuclei. The details of the model are described in our previous work (Vich et al., 2022) as well as in the ‘Neuron model’ section below for the sake of completeness.
Corticostriatal weights for D1 and D2 neurons in striatum were modulated by phasic dopamine to model the influence of reinforcement learning on network dynamics. The details of STDP learning are described in detail in previous work (Vich et al., 2020), but key details are shown below. As a result of these features of the CBGT network, it was capable of learning under realistic experimental paradigms with probabilistic reinforcement schemes (i.e., under reward probabilities and unstable action–outcome values).
Threshold for CBGT network decisions
Request a detailed protocolA decision between the two competing actions (‘left’ and ‘right’) was considered to be made when either of the thalamic subpopulations reached a threshold of 30 Hz. This threshold was set based on the network dynamics for the chosen parameters with the aim of obtaining realistic reaction times. The maximum time allowed to reach a decision was 1000 ms. If none of the thalamic subpopulations reached the threshold of 30 Hz, no action was considered to be taken. Such trials were dropped from further analysis. Reaction times were calculated as time from stimulus onset to decision (either subpopulation reaches the threshold). The ‘slow’ and ‘fast’ trials were categorized as reaction times ≥75th percentile (314.5 ms) and reactions time <50 th percentile (196.0 ms), respectively, of the reaction time distributions. The firing rates of the CBGT nuclei during the reaction times were used for prediction analysis as discussed in our description of single-trial response estimation below.
Corticostriatal weight plasticity
Request a detailed protocolThe corticostriatal weights are modified by a dopamine-mediated STDP rule, where the phasic dopamine is modulated by reward prediction error. The internal estimate of the reward is calculated at every trial by a Q-learning algorithm and is subtracted from the reward associated with the experimental paradigm to yield a trial-by-trial estimate of the reward prediction error. The effect of dopaminergic release is receptor dependent; a rise in dopamine promotes potentiation for dSPNs and depression for iSPNs. The degree of change in the weights is dependent on an eligibility trace, which is proportional to the coincidental presynaptic (cortical) and postsynaptic (striatal) firing rates. The STDP rule is described in detail in Vich et al., 2020 as well as in the appendix.
In silico experimental design
Request a detailed protocolWe follow the paradigm of a two-arm bandit task, where the CBGT network learns to consistently choose the rewarded action until the block changes (i.e., the reward contingencies switch), at which point the CBGT network relearns the rewarded action (reversal learning). Each session consists of 40 trials with a block change every 10 trials. The reward probabilities represent a conflict of (75%, 25%); that is, in a left block, 75% of the left actions are rewarded, whereas 25% of the right actions are rewarded. The inter-trial-interval in network time is fixed to 600 ms.
To maximize the similarity between the CBGT network simulations and our human data, we randomly varied the initialization of the network such that neurons with a specific connection probability were randomly chosen for each simulated subject, with the background input to the nuclei for each simulated subject as a mean-reverting random walk (noise was drawn from the normal distribution ). These means are listed in Supplementary file 6.
Participants
Four neurologically healthy adult humans (two female, all right-handed, 29–34 years old) were recruited and paid $30 per session, in addition to a performance bonus and a bonus for completing all nine sessions. These participants were recruited from the local university population.
All procedures were approved by the Carnegie Mellon University Institutional Review Board (Approval Code: ). All research participants provided informed consent to participate in the study and consent to publish any research findings based on their provided data.
Experimental design
Request a detailed protocolThe experiment used male and female Greebles (Gauthier and Tarr, 1997) as selection targets. Participants were first trained to discriminate between male and female Greebles to prevent errors in perceptual discrimination from interfering with selection on the basis of value. Using a two-alternative forced choice task, participants were presented with a male and female Greeble and asked to select the female, with the male and female Greeble identities resampled on each trial. Participants received binary feedback regarding their selection (correct or incorrect). This criterion task ended after participants reached 95% accuracy. After reaching perceptual discrimination criterion for each session, each participant was tested under nine reinforcement learning conditions composed of 300 trials each, generating 2700 trials per participant in total. Data were collected from four participants in accordance with a replication-based design, with each participant serving as a replication experiment. Participants completed these sessions in randomized order. Each learning trial presented a male and female Greeble (Gauthier and Tarr, 1997), with the goal of selecting the gender identity of the Greeble that was most rewarding. Because individual Greeble identities were resampled on each trial, the task of the participant was to choose the gender identity rather than the individual identity of the Greeble, which was most rewarding.
Probabilistic reward feedback was given in the form of points drawn from the normal distribution and converted to an integer. These points were displayed at the center of the screen. For each run, participants began with 60 points and lost one point for each incorrect decision. To promote incentive compatibility (Rosenzweig and Evenson, 1977), participants earned a cent for every point earned. Reaction time was constrained such that participants were required to respond within between 0.1 s and 0.75 s from stimulus presentation. If participants responded in s, s, or failed to respond altogether, the point total turned red and decreased by 5 points. Each trial lasted 1.5 s and reward feedback for a given trial was displayed from the time of the participant’s response to the end of the trial. To manipulate change point probability, the gender identity of the most rewarding Greeble was switched probabilistically, with a change occurring every 10, 20, or 30 trials, on average. To manipulate the belief in the value of the optimal target, the probability of reward for the optimal target was manipulated, with p set to 0.65, 0.75, or 0.85. Each session combined one value of p with one level of volatility, such that all combinations of change point frequency and reward probability were imposed across the nine sessions. Finally, the position of the high-value target was pseudo-randomized on each trial to prevent prepotent response selections on the basis of location.
Behavioral analysis
Request a detailed protocolStatistical analyses and data visualization were conducted using custom scripts written in R (R Foundation for Statistical Computing, version 3.4.3) and Python (Python Software Foundation, version 3.5.5). Scripts are publicly available (Bond et al., 2023).
Binary accuracy data were submitted to a mixed effects logistic regression analysis with either the degree of conflict (the probability of reward for the optimal target) or the degree of volatility (mean change point frequency) as predictors. The resulting log-likelihood estimates were transformed to likelihood for interpretability. RT data were log-transformed and submitted to a mixed effects linear regression analysis with the same predictors as in the previous analysis. To determine if participants used ideal observer estimates to update their behavior, two more mixed effects regression analyses were performed. Estimates of change point probability and the belief in the value of the optimal target served as predictors of reaction time and accuracy across groups. As before, we used a mixed logistic regression for accuracy data and a mixed linear regression for reaction time data.
Estimating evidence accumulation using drift diffusion modeling
Request a detailed protocolTo assess whether and how much the ideal observer estimates of change point probability () and the belief in the value of the optimal target () (Nassar et al., 2010; Bond et al., 2021) updated the rate of evidence accumulation (), we regressed the change point-evoked ideal observer estimates onto the decision parameters using hierarchical drift diffusion model (HDDM) regression (Wiecki et al., 2013). These ideal observer estimates of environmental uncertainty served as a more direct and continuous measure of the uncertainty we sought to induce with our experimental manipulations. Using this more direct approach, we pooled change point probability and belief across all conditions and used these values as our predictors of drift rate and boundary height. Responses were accuracy-coded, and the belief in the difference between targets values was transformed to the belief in the value of the optimal target (). This approach allowed us to estimate trial-by-trial covariation between the ideal observer estimates and the decision parameters.
To find the models that best fit the observed data, we conducted a model selection process using deviance information criterion (DIC) scores. A lower DIC score indicates a model that loses less information. Here, a difference of ≤ 2 points from the lowest-scoring model cannot rule out the higher scoring model; a difference of 3–7 points suggests that the higher scoring model has considerably less support; and a difference of 10 points suggests essentially no support for the higher scoring model (Spiegelhalter et al., 2002; Burnham and Anderson, 1998). We evaluated the DIC scores for the set of fitted models relative to an intercept-only regression model (DICintercept - DICmodeli).
MRI data acquisition
Request a detailed protocolNeurologically healthy human participants (N = 4, two females) were recruited. Each participant was tested in nine separate imaging sessions using a 3T Siemens Prisma scanner. Session 1 included a set of anatomical and functional localizer sequences (e.g., visual presentation of Greeble stimuli with no manual responses, and left vs. right button responses to identify motor networks). Sessions 2–10 collected five functional runs of the dynamic two-armed bandit task (60 trials per run). Male and female ‘Greebles’ served as the visual stimuli for the selection targets (Gauthier and Tarr, 1997), with each presented on one side of a central fixation cross. Participants were trained to respond within 1.5 s.
To minimize the convolution of the hemodynamic response from trial to trial, inter-trial intervals were sampled according to a truncated exponential distribution with a minimum of 4 s between trials, a maximum of 16 s, and a rate parameter of 2.8 s. To ensure that head position was stabilized and stable over sessions, a CaseForge head case was customized and printed for each participant. The task-evoked hemodynamic response was measured using a high spatial (2 mm3 voxels) and high temporal (750 ms TR) resolution echo planar imaging approach. This design maximized recovery of single-trial evoked BOLD responses in subcortical areas, as well as cortical areas with higher signal-to-noise ratios. During each functional run, eye-tracking (EyeLink, SR Research Inc), physiological signals (ECG, respiration, and pulse oximetry via the Siemens PMU system) were also collected for tracking attention and for artifact removal.
Preprocessing
Request a detailed protocolfMRI data were preprocessed using the default fMRIPrep pipeline (Esteban et al., 2019), a standard toolbox for fMRI data preprocessing that is robust to variations in scan acquisition protocols and minimal user manipulation.
Single-trial response estimation
Request a detailed protocolWe used a univariate GLM to estimate within-participant trial-wise responses at the voxel level. Specifically, for each fMRI run, preprocessed BOLD time series were regressed onto a design matrix, where each task trial corresponded to a different column, and was modeled using a boxcar function convolved with the default hemodynamic response function given in SPM12. Thus, each column in the design matrix estimated the average BOLD activity within each trial. In order to account for head motion, the six realignment parameters (three rotations, three translations) were included as covariates. In addition, a high-pass filter (128 s) was applied to remove low-frequency artifacts. Parameter and error variance were estimated using the RobustWLS toolbox, which adjusts for further artifacts in the data by inversely weighting each observation according to its spatial noise (Diedrichsen and Shadmehr, 2005).
Finally, estimated trial-wise responses were concatenated across runs and sessions and then stacked across voxels to give a matrix, , of T (trial estimations) × V (voxels) for each participant.
Single-trial response prediction
Request a detailed protocolA machine learning approach was applied to predict left/right Greeble choices from the trial-wise responses. First, using the trial-wise hemodynamic responses, we estimated the contrast in neural activation when the participant made a left versus right selection. A LASSO-PCR classifier (i.e., an L1-constrained principal component logistic regression) was estimated for each participant according to the below procedure. We should note that the choice of LASSO-PCR was based on prior work building reliable classifiers from whole-brain-evoked responses that maximizes inferential utility (see Meissner et al., 2011). This approach is used in case of over-parameterization, as when there are more voxels than observations, and relies on a combination of dimensionality reduction and sparsity constraints to find the effective complexity of a model.
First, a singular value decomposition (SVD) was applied to the input matrix :
(1)
where the product matrix represents the principal component scores, that is, the values of projected into the principal component space, and an orthogonal matrix whose rows are the principal directions in feature space. Then the binary response variable (left/right choice) was regressed onto , where the estimation of the coefficients is subject to an L1 penalty term in the objective function:
(2)
where and Z include the intercept term, , and N is the number of observations.
Projection of the estimated coefficients back to the original feature (voxel) space was done to yield a weight map , which in turn was used to generate final predictions :
(3)
where denotes the vector of voxel-wise responses for a given trial (i.e., a given row in the matrix). When visualizing the resulting weight maps, these were further transformed to encoded brain patterns. This step was performed to aid in correct interpretation in terms of the studied brain process because doing this directly from the observed weights in multivariate classification (and regression) models can be problematic (Winkler et al., 2015).
Here, the competition between left–right neural responses decreases classifier decoding accuracy as neural activation associated with these actions becomes less separable. Therefore, classifier prediction serves as a proxy for response competition. To quantify uncertainty from this, we calculated the Euclidean distance of these decoded responses from the statistically optimal choice on a given trial, . This yielded a trial-wise uncertainty metric derived from the decoded competition between neural responses.
(4)
The same analytical pipeline was used to calculate single-trial responses for simulated data with a difference that trial-wise average firing rates of all nuclei from the simulations were used instead of fMRI hemodynamic responses.
Robustness analysis
Request a detailed protocolTo test whether our key effects were robust to variation in parameter schemes, 300 networks were sampled using Latin Hypercube Sampling (LHS), as also described in Vich et al., 2022. From this, we chose two network configurations with biologically plausible parameters, one with slower and faster reaction times (‘fast’ and ‘slow’ networks; upper and lower quartile of the reaction time distributions). We then repeated our key analyses for these two network configurations as shown in Figure 2—figure supplement 1. We show that these adaptive network effects are robust over a range of parameter configurations, so long as the network generates firing rates are biologically plausible.
Neuron model
Request a detailed protocolWe used an integrate-and-fire-or-burst model that models the membrane potential as
(5)
where represents the leak conductance, is the leak reversal potential and the first term is the leak current; the next term is a low threshold current with maximum conductance , gating variable , and reversal potential , which activates when due to the Heaviside function is the synaptic current and is the external current. This neuron model is capable of producing post-inhibitory bursts, regulated by the gating variable that decays with the time constant , when the membrane potential reaches a certain threshold and rises with time constant . However, when is set to zero, the model reduces to a leaky integrate and fire neuron. Currently, we model GPe and STN neuronal populations with bursty neurons and the remaining neuronal populations with leaky integrate-and-fire neurons, all with conductance-based synapses.
The synaptic current consists of three components, two excitatory currents corresponding to AMPA and NMDA receptors and one inhibitory current corresponding to GABA receptors, and is calculated as below:
where represents the maximum conductance corresponding to the receptor {AMPA, NMDA, GABA}, and represent the excitatory and inhibitory reversal potentials, and represents the gating variable for each current, with dynamics given by
The gating variables for AMPA and GABA act as leaky integrators that are increased by all incoming spikes, with an additional constraint for NMDA that ensures that the maximum value of remains below 1.
The values of neuronal parameters for all of the nuclei are listed in Supplementary file 3, external inputs to the CBGT nuclei are listed in Supplementary file 4, synaptic parameter values are listed in Supplementary file 5, connectivity types and probabilities are listed in Supplementary file 6, and the number of neurons in each CBGT population is shown in Supplementary file 7.
Spike timing-dependent plasticity rule
Request a detailed protocolThe plasticity rule we use is a dopamine-modulated STDP rule also described in Vich et al., 2020. All the values of the relevant parameters are listed in Supplementary file 8. The weight update of a corticostriatal synapse is controlled by three factors: (1) an eligibility trace, (2) the type of the striatal neuron (iSPN/dSPN), and (3) the level of dopamine.
To compute the eligibility for a given synapse, an activity trace of each neuron in the presynaptic and postsynaptic populations is tracked via the equations
where are spike trains, such that and maintain a filtered record of synaptic spiking of the pre/post neuron, respectively, with spike impact parameters and time constants .
If the postsynaptic spike follows the spiking activity of the presynaptic population closely enough in time, then the eligibility variable increases and allows for plasticity to occur. On the other hand, if a presynaptic spike follows the spiking activity of the postsynaptic population, then decreases. In the absence of any activity and spikes, the eligibility trace decays to zero with a time constant . Putting these effects together, we obtain the equation
The synaptic weight update depends on the dopamine receptor type of the striatal neuron; that is, if the neuron is a dSPN or iSPN. We assume that a phasic dopamine release promotes long-term potentiation (LTP) in dSPNs and long-term depression (LTD) in iSPNs. This factor is indicated by the learning rate parameter , which is set to a positive value for dSPNs and a negative value for iSPNs. The weight update dynamics is given by
(6)
where {dSPN, iSPN} with and . Here, the weights of the corticostriatal synapses are bounded between the maximal value , which depends on the SPN type, and a minimal value of . The precise values used for all relevant parameters are listed in Supplementary file 3.
In the weight update rule (6), represents the dopamine level present. This quantity changes as a result of phasic release of dopamine (increments of size ), which is correlated to the reward prediction error encountered in the environment. We define a parameter that sets the scaling between the reward prediction error and the amount of dopamine released, and obeys the equation
where
for reward and expected value of the chosen action. Trial-by-trial estimates of the values of the actions (left/right) are maintained by a simple Q-update rule:
where {left, right} and where represents the learning rate of the Q-values.
Finally, the function converts the level of dopamine into an impact on plasticity in a way that depends on the identity of the postsynaptic neuron, as follows:
where sets the dopamine level at which reaches half-maximum. Supplementary file 8 lists the specific parameters used for the STDP rule.
Data availability
Behavioral data and computational derivatives are publically available here: https://github.com/kalexandriabond/competing-representations-shape-evidence-accumulation (copy archived at Bond, 2023). Raw and preprocessed hemodynamic data, in addition to physiological measurements collected for quality control, are available here: https://openneuro.org/datasets/ds004283/versions/1.0.3.
References
-
Encoding by synchronization in the primate striatumThe Journal of Neuroscience 33:4854–4866.https://doi.org/10.1523/JNEUROSCI.4791-12.2013
-
The functional anatomy of disorders of the basal gangliaTrends in Neurosciences 18:63–64.https://doi.org/10.1016/0166-2236(95)80020-3
-
Parallel organization of functionally segregated circuits linking basal ganglia and cortexAnnual Review of Neuroscience 9:357–381.https://doi.org/10.1146/annurev.ne.09.030186.002041
-
A competitive model for striatal action selectionBrain Research 1713:70–79.https://doi.org/10.1016/j.brainres.2018.10.009
-
Learning the value of information in an uncertain worldNature Neuroscience 10:1214–1221.https://doi.org/10.1038/nn1954
-
The neural basis of the speed-accuracy tradeoffTrends in Neurosciences 33:10–16.https://doi.org/10.1016/j.tins.2009.09.002
-
Dopaminergic modulation of the striatal microcircuit: receptor-specific configuration of cell assembliesThe Journal of Neuroscience 31:14972–14983.https://doi.org/10.1523/JNEUROSCI.3226-11.2011
-
Caudate encodes multiple computations for perceptual decisionsThe Journal of Neuroscience 30:15747–15759.https://doi.org/10.1523/JNEUROSCI.2894-10.2010
-
The basal ganglia: from motor commands to the control of vigorCurrent Opinion in Neurobiology 37:158–166.https://doi.org/10.1016/j.conb.2016.02.005
-
Reward-driven changes in striatal pathway competition shape evidence evaluation in decision-makingPLOS Computational Biology 15:e1006998.https://doi.org/10.1371/journal.pcbi.1006998
-
Working together: basal ganglia pathways in action selectionTrends in Neurosciences 37:301–303.https://doi.org/10.1016/j.tins.2014.04.004
-
The neural basis of decision makingAnnual Review of Neuroscience 30:535–574.https://doi.org/10.1146/annurev.neuro.29.051605.113038
-
Neural substrates of the drift-diffusion model in brain disordersFrontiers in Computational Neuroscience 15:678232.https://doi.org/10.3389/fncom.2021.678232
-
Distinct roles for direct and indirect pathway striatal neurons in reinforcementNature Neuroscience 15:816–818.https://doi.org/10.1038/nn.3100
-
From reinforcement learning models to psychiatric and neurological disordersNature Neuroscience 14:154–162.https://doi.org/10.1038/nn.2723
-
The placebo effect: advances from different methodological approachesThe Journal of Neuroscience 31:16117–16124.https://doi.org/10.1523/JNEUROSCI.4099-11.2011
-
Learning reward uncertainty in the basal gangliaPLOS Computational Biology 12:e1005062.https://doi.org/10.1371/journal.pcbi.1005062
-
The basal ganglia: focused selection and inhibition of competing motor programsProgress in Neurobiology 50:381–425.https://doi.org/10.1016/s0301-0082(96)00042-1
-
An approximately Bayesian delta-rule model explains the dynamics of belief updating in a changing environmentThe Journal of Neuroscience 30:12366–12378.https://doi.org/10.1523/JNEUROSCI.0822-10.2010
-
Rational regulation of learning dynamics by pupil-linked arousal systemsNature Neuroscience 15:1040–1046.https://doi.org/10.1038/nn.3130
-
The drift diffusion model as the choice rule in reinforcement learningPsychonomic Bulletin & Review 24:1234–1251.https://doi.org/10.3758/s13423-016-1199-y
-
Fertility, schooling, and the economic contribution of children in rural India: an econometric analysisEconometrica 45:1.
-
The credit assignment problem in cortico-basal ganglia-thalamic networks: A review, a problem and a possible solutionThe European Journal of Neuroscience 53:2234–2253.https://doi.org/10.1111/ejn.14745
-
Bayesian measures of model complexity and fitJournal of the Royal Statistical Society Series B 64:583–639.https://doi.org/10.1111/1467-9868.00353
-
Basal ganglia contributions to motor control: a vigorous tutorCurrent Opinion in Neurobiology 20:704–716.https://doi.org/10.1016/j.conb.2010.08.022
-
Corticostriatal synaptic weight evolution in a two-alternative forced choice task: a computational studyCommunications in Nonlinear Science and Numerical Simulation 82:105048.https://doi.org/10.1016/j.cnsns.2019.105048
-
Identifying control ensembles for information processing within the cortico-basal ganglia-thalamic circuitPLOS Computational Biology 18:e1010255.https://doi.org/10.1371/journal.pcbi.1010255
-
Role of the indirect pathway of the basal ganglia in perceptual decision makingThe Journal of Neuroscience 35:4052–4064.https://doi.org/10.1523/JNEUROSCI.3611-14.2015
-
HDDM: hierarchical bayesian estimation of the drift-diffusion model in pythonFrontiers in Neuroinformatics 7:14.https://doi.org/10.3389/fninf.2013.00014
-
Inferring relevance in a changing worldFrontiers in Human Neuroscience 5:189.https://doi.org/10.3389/fnhum.2011.00189
Decision letter
-
Tobias H DonnerReviewing Editor; University Medical Center Hamburg-Eppendorf, Germany
-
Floris P de LangeSenior Editor; Donders Institute for Brain, Cognition and Behaviour, Netherlands
Our editorial process produces two outputs: (i) public reviews designed to be posted alongside the preprint for the benefit of readers; (ii) feedback on the manuscript for the authors, including requests for revisions, shown below. We also include an acceptance summary that explains what the editors found interesting or important about the work.
Decision letter after peer review:
[Editors’ note: the authors submitted for reconsideration following the decision after peer review. What follows is the decision letter after the first round of review.]
Thank you for submitting your article "Competing neural representations of choice shape evidence accumulation in humans" for consideration by eLife. Your article has been reviewed by 2 peer reviewers, and the evaluation has been overseen by a Reviewing Editor and Floris de Lange as the Senior Editor. The reviewers have opted to remain anonymous.
The reviewers have discussed their reviews with one another, and the Reviewing Editor has drafted this to help you prepare a revised submission.
Essential revisions:
1) Overall, reviewers felt that the study would benefit from (i) the derivation of more (and/or more specific) model predictions from the neural circuit model (ii) more in-depth analyses of the fMRI data, and (iii) further steps to link DDM, circuit model, and fMRI data.
For e.g. model-based analyses could be performed to elucidate the activity dynamics and link that to the circuit model. This could perhaps be done e.g. with slow and fast responses, and identify brain regions with ramping activities over time as in the model (e.g. Supp. Figure 1).
2) Please clarify the correlation between drift and model uncertainty (figure 2E) and drift and fMRI classifier uncertainty (figure 4B), and explain the largely weaker association between classier uncertainty and drift rate (Figure 4B), and the weak reaction time effects (Supp. Figure 2).
We assume that the posterior probability distributions shown are obtained from the HDDM single-trial regression mode. Should the spiking NN model and the fMRI results not be compared to a simpler null model (e.g. with a weighted average of past responses) to know how much it is an improvement over previous work?
3) Please discuss why the model's cortical neurons had no contralateral encoding, unlike the fMRI data.
4) Please clarify why the prediction of CBGT network choices (lines 130-131) is not 100%:
Presumably, all the relevant information (firing rates of all regions modelled) together should perfectly predict the choice. (How crucial is the choice of the LASSO-PCR classifier over other classifiers?)
5) Please clarify the terminology:
– Throughout, there are aspects of the manuscript that make it hard for the reader to follow. For instance, in Figure 1 the terms D1-SPN/D2-SPN are used interchangeably with dSPN and iSPN, and the legend and the text differ in what the time = 0 indicates (stimulus or decision).
– Change of mind in the literature is now more linked to a trial change in (impending) choices, a more recent research area (e.g. Resulaj et al., Nat. 2009), and the phrase change of mind is not as suitable for use in this work. I would replace such phrases with phrases like adaptive decision/choice (learned over trials) or similar.
6) Please revise the abstract: It is currently too general and vague.
Reviewer #1 (Recommendations for the authors):
Specific comments and recommendations:
1. Further analysis of the fMRI data may be needed. E.g. model-based analysis to elucidate the activity dynamics and link that to the biophysical data. This could perhaps be done e.g. with slow and fast responses, and identify brain regions with ramping activities over time as in the model (e.g. Supp. Figure 1).
2. Provide an explanation for the (order of magnitude) weaker association between classier uncertainty and drift rate (by participants) for human participants (Figure 4B), and the weak reaction time effects in Supp. Figure 2.
3. Discuss why the model's cortical neurons had no contralateral encoding, unlike in the neuroimaging data.
4. Change of mind in the literature is now more linked to within trial change in (impending) choices, a more recent research area (e.g. Result et al., Nat. 2009), and the phrase change of mind is not as suitable for use in this work. I would replace such phrases with phrases like adaptive decision/choice (learned over trials) or similar.
5. Supp. Figure 4. It would have been clearer to show the activity dynamics over time for the key brain regions, e.g. with fast and slow decisions. Is there actually ramping of activity over time? Could brain regions linked to dopaminergic activity be obtained and related to that in model simulations?
6. Supp. Figure 5A. Why are the weights for GPi so strong, but not much in humans?
7. Supp. Table 1. Why is the accuracy so low, hovering around the chance level?
8. Lines 470-471. Is there any non-decision latency (e.g. signal transduction and motor preparation) to bridge from decision time to reaction time?
9. Lines 604-605. The use of the classifier LASSO-PCR was not justified.
Reviewer #2 (Recommendations for the authors):
I will focus mostly on the behavioral task and HDDM model, as well as the link between behavior and the in silico model. My expertise does not lie in evaluating the details of the spiking neural network model, or the processing of fMRI data.
Specific questions:
– One methodological concern/clarification: the correlation between drift and model uncertainty (figure 2E) and drift and fMRI classifier uncertainty (figure 4B) seems the crucial test of the similarity between brain, behavior, and model. However, drift is not usually fit on a single trial level. So, I think the distributions shown are the posteriors from the HDDM regression model – but if so, should the spiking NN model + the fMRI results not be compared to a simpler null model (e.g. with a weighted average of past responses) to know how much it's an improvement over previous work?
– A block switch every 10 trials seems very easy to learn (i.e. simply by counting). Did any of the four humans take this strategy?
– I'm a bit puzzled the prediction of CBGT network choices (lines 130-131) is not 100%, since presumably all the relevant information (firing rates of all regions modelled) together should perfectly predict the choice. How crucial is the choice of the LASSO-PCR classifier (over other classifiers)?
[Editors’ note: further revisions were suggested prior to acceptance, as described below.]
Thank you for resubmitting the paper entitled "Competing neural representations of choice shape evidence accumulation in humans" for further consideration by eLife. Your revised article has been evaluated by a Senior Editor and a Reviewing Editor. We are sorry to say that we have decided that this submission will not be considered further for publication by eLife.
We appreciate your efforts in trying to address the reviewers' points. While the reviewers were satisfied with several of your responses, there are remaining issues. Most importantly, both reviewers felt that the study, while useful, appears a bit preliminary and the evidence in support of your conclusions remains incomplete.
Reviewer #1 (Recommendations for the authors):
The overall responses from the authors were mainly satisfactory, but further concerns remain.
1. Perhaps the authors can replace the spiking neural network model with simpler network-RL-based theoretical models that are more suitably linked and optimised to BOLD-fMRI data or remove the spiking neural network model which can be used and validated in their subsequent future work based on more precise neural recording.
2. Both CBGT and DDMs' parameters did not seem to be optimised. The authors' justification is that model optimisation based on experimental data could lead to 'circular' inference. Although I can understand this to some extent, especially with physiologically constrained model, I am not sure whether I fully agree with this claim. In any case, the authors should at least summarise clearly which CBGT and DDM parameters were free, which were constrained, and which were tuned – a summary table may help.
Overall, this work is interesting and could potentially contribute to the computational modelling and neuroscience of adaptive choice behaviour. However, a major component of the work, on the CBGT modelling, seems somewhat premature.
Reviewer #2 (Recommendations for the authors):
I thank the authors for clarifying various technical details.
While this is solid work, I am still unsure as to the main insights we can draw from this paper itself. The main argument for using the fine-scale model to account for fMRI data is that it sets the stage for future work, which will compare these model predictions with mouse data. As much as I understand that this is how science goes, the result for this paper is that linking fMRI and the detailed model is a bit strange (and makes it much harder to draw conclusions from). For the general readership of eLife, I'm not sure if the current insights are very helpful before knowing the results of the more fine-grained data that are currently being collected.
[Editors’ note: further revisions were suggested prior to acceptance, as described below.]
Thank you for choosing to send your work entitled "Competing neural representations of choice shape evidence accumulation in humans" for consideration at eLife.
Your letter of appeal has now been considered by myself as Senior Editor and Tobias as Reviewing Editor, and we had the time to discuss it. We apologize for the delay in responding to your appeal: it reached us when Tobias was just leaving for vacation; after his return, Floris was not available for some time.
After careful consideration, we are now prepared to receive a revised submission (with no guarantees of acceptance), which implements the revision plan you have outlined in your appeal.
We would like to stress that we do see the value of model-based neuroimaging in general, including work that uses biophysically detailed circuit models. We neither see the need for a general justification of such approaches, nor for references to other work using circuit modelling of fMRI data, in your paper. What we feel does need justification, in light of the comments by both reviewers, is the choice of your specific modeling approach for these particular (task) data. We also feel that a discussion of the limitations of your approach is warranted that takes into account the concerns raised by both reviewers.
https://doi.org/10.7554/eLife.85223.sa1Author response
[Editors’ note: The authors appealed the original decision. What follows is the authors’ response to the first round of review.]
Essential revisions:
1) Overall, reviewers felt that the study would benefit from (i) the derivation of more (and/or more specific) model predictions from the neural circuit model (ii) more in-depth analyses of the fMRI data, and (iii) further steps to link DDM, circuit model, and fMRI data.
For e.g. model-based analyses could be performed to elucidate the activity dynamics and link that to the circuit model. This could perhaps be done e.g. with slow and fast responses, and identify brain regions with ramping activities over time as in the model (e.g. Supp. Figure 1).
We agree that a fine-grained analysis of intra-trial dynamics would be an ideal complement to our current approach. However, due to the timing of the trials in relation to the lag and auto-correlational structure of the BOLD response, this sort of analysis would not yield productive results, as the entire trial is encompassed by a single evoked response. Our findings are primarily focused on variations in the magnitude of the evoked response, rather than the temporal dynamics within the trial. Although we acknowledge the importance of investigating these intra-trial dynamics, this requires neurophysiological recording with much higher temporal resolution, as the limitations of fMRI restrict our ability to evaluate them.
This difference in resolution, understandably, raises the question of why we compared a model with intra-trial neuronal dynamics with the hemodynamic response. The reason we use a biologically realistic neural network model is precisely so that it can be used as a theory bridge between multiple lines of experimentation, from macroscopic BOLD responses in humans to spiking responses in rodents (ongoing collaborative work with our lab). So this approach does have clear benefits in laying the groundwork for future research that can reveal the intricacies of the underlying mechanisms. This is done using an upward mapping perspective, where lower-level implementation models represent the biophysical properties of neurons and synapses, and higher-level models capture the emergent properties of these neural networks. This strategy allows us to make predictions at different levels of abstraction, from molecular and cellular to behavioral and cognitive, by leveraging information from lower-level models to inform higher-level ones.
For example, in our ongoing work, we are using the same neural network to test our predictions about D1 and D2 optogenetic stimulation in mice. The complexity of the model is essential for this purpose, as it provides a comprehensive framework that captures the intricacies of the underlying neural mechanisms.
In the current paper, we compared fMRI findings with the predicted dynamics at a common level of abstraction. However, due to the differences in resolution between these two approaches, our comparison is necessarily coarse. Nonetheless, we think that our approach serves as a valuable foundation for future work that can reveal the subtle details of the neural processes involved.
2) Please clarify the correlation between drift and model uncertainty (figure 2E) and drift and fMRI classifier uncertainty (figure 4B), and explain the largely weaker association between classier uncertainty and drift rate (Figure 4B), and the weak reaction time effects (Supp. Figure 2).
Indeed, this is a valid point. We now acknowledge the difference in magnitude of effects observed between the simulated and human data, and we have identified four reasons for this disparity.
First, the simulated data is not subject to the same sources of noise as the human data. The human data reflects a macroscopic proxy of underlying neural dynamics and has a strong autocorrelation structure in the signal, which adds substantial variability, attenuating the magnitude of any correlational effects with behavior.
Second, the model is not susceptible to other non-task related variance that humans are likely to experience, such as fatigue or attentional lapses.
Third, we used the model to predict the associations that we would see in humans to maintain the independence of the prediction. We did not fine-tune the model using human data to avoid circular inference. Though we can now use this data for future theoretical predictions.
Lastly, for the sake of simplicity, the simulations used only one experimental condition with a deterministic frequency of a shift in the statistically optimal option, while our human experiments varied the relative value of the two options and volatility, which are stochastic. This led to increased variance in human responses, providing more information to work with but decreased precision.
Although the qualitative pattern of results was the focus of our study, we have clarified the reasons for the difference in magnitude between the human and simulated data in the Discussion section of the revised manuscript.
We assume that the posterior probability distributions shown are obtained from the HDDM single-trial regression mode.
We agree that this was not clear. Figures 2E and 4B show bootstrapped distributions of the association test (Β weight) between classifier uncertainty and drift rate, not the HDDM posteriors. We now clarify this in the figure captions.
Should the spiking NN model and the fMRI results not be compared to a simpler null model (e.g. with a weighted average of past responses) to know how much it is an improvement over previous work?
We now clarify that we compared all pairwise and single-parameter variants of the HDDM model, along with a null model predicting average responses (no change in decision policy). The drift-rate model provided the best fit to our data among these comparisons.
However, we did not test an alternative to the central hypothesis linking behavior and implementation to decision policy. This is key to our central claim in the paper, so we thank the editor and reviewer for pointing this out. To this end, we now analyze boundary height as our target variable associated with classifier uncertainty. This parameter showed no association with classifier uncertainty. We present the results of this analysis in Figure 4 – Figure Supp. 1.
3) Please discuss why the model's cortical neurons had no contralateral encoding, unlike the fMRI data.
Thank you for pointing out the need to clarify our modeling decisions. Our model of the CBGT circuit assumes that distinct populations represent unique actions and it is agnostic to the specific laterality (or any other regional localization) in the brain. Our model assumptions hold as long as the populations representing the actions are unique, regardless of hemisphere. We have clarified this in the main text.
4) Please clarify why the prediction of CBGT network choices (lines 130-131) is not 100%:
Presumably, all the relevant information (firing rates of all regions modelled) together should perfectly predict the choice. (How crucial is the choice of the LASSO-PCR classifier over other classifiers?)
With respect to the behavioral accuracy of the CBGT model, it should be noted that this was a probabilistic decision-making task. For the model, the optimal choice was rewarded 75% of the time while the other choice was rewarded 25% of the time. This means that achieving a 100% accuracy in selecting the statistically optimal choice would result in a ceiling accuracy of 75%. However, the fact that the model does not reach 100% accuracy is actually a feature, not a bug, as it reflects the network's experience of decision uncertainty. This variability is leveraged to evaluate our primary hypothesis regarding uncertainty across action channels and drift rate in the decision process.
Regarding the choice of classifier, we used the LASSO-PCR approach, a common method for building whole brain classifiers (see Wager et al. 2011), because it is a conservative approach to inference on high dimensional data. While other machine learning methods could have been used to handle high data complexity, many of them are "black box" and make interpretability more challenging. We could have also used ridge regression or elastic net combined with PCR, but these are unlikely to change the overall conclusions of our findings because of the complete independence of each principal component.
Nonetheless, we have conducted a follow-up analysis on the neuroimaging data without the LASSO regularization step, to show how a more traditional decoder model (PCR) would do.
This produced largely the same accuracy as our model with LASSO penalties, as shown in item 4 for Reviewer #1 under minor concerns. Despite the fact that the choice of classifier parameters has a minor impact on the accuracy, we have chosen to keep the LASSO-PCR model to maintain a conservative approach and improved classifier accuracy. However, our data and code are publicly available for anyone interested in exploring different classification models for predicting human choices.
Further justification for our analysis choice has been added to the Methods and Results sections.
5) Please clarify the terminology:
– Throughout, there are aspects of the manuscript that make it hard for the reader to follow. For instance, in Figure 1 the terms D1-SPN/D2-SPN are used interchangeably with dSPN and iSPN, and the legend and the text differ in what the time = 0 indicates (stimulus or decision).
We now consistently refer to direct and indirect pathway SPNs as dSPN and iSPN, respectively.
– Change of mind in the literature is now more linked to a trial change in (impending) choices, a more recent research area (e.g. Resulaj et al., Nat. 2009), and the phrase change of mind is not as suitable for use in this work. I would replace such phrases with phrases like adaptive decision/choice (learned over trials) or similar.
Thanks for pointing this out! To minimize confusion, we have adopted the term "flexible decision-making" to refer to a change of mind instead.
6) Please revise the abstract: It is currently too general and vague.
We have overhauled the abstract to increase its specificity.
Reviewer #1 (Recommendations for the authors):
Specific comments and recommendations:
1. Further analysis of the fMRI data may be needed. E.g. model-based analysis to elucidate the activity dynamics and link that to the biophysical data. This could perhaps be done e.g. with slow and fast responses, and identify brain regions with ramping activities over time as in the model (e.g. Supp. Figure 1).
Intuitively we fundamentally agree with the reviewer’s comment – what exactly is it about the fMRI responses that delineates shifts in response policies to change? It is appealing to look for something like the accumulatoresque dynamics reported by the Shadlen lab and others from neurophysiological recordings. However, we are fundamentally limited due to the nature of the hemodynamic response itself. This signal is essentially a very low-pass filtered version of aggregated neural (and non-neural) responses over the course of the entire trial. We simply do not have the temporal resolution with this signal to do the fine grained temporal analysis of fast and slow trials. What we get is essentially variation in the amplitude of the aggregate response to the entire trial. This is what is captured in our single-trial response estimates at the core of our analysis.
In fact, this limitation is why we chose to represent the macroscopic network dynamics as classifier uncertainty. This allows us to cleanly link the cognitive model results to both the behavior and the neural dynamics at the trial-by-trial level using only two variables (drift rate and classifier uncertainty).
Nonetheless, we now clarify this in the manuscript:
“In other words, the distance from the optimal target should increase with increased co-activation of circuits that represent opposing actions. The decision to model aggregate trial dynamics with a classifier stems from the limitations of the hemodynamic response that we will use next to vet the model predictions in humans. The low temporal resolution of the evoked BOLD signal makes finer-grained temporal analysis for the human data impossible, as the signal is a low-pass filtered version of the aggregate response over the entire trial. So, we chose to represent the macroscopic network dynamics as classifier uncertainty, that cleanly links the cognitive model results to both behavior and neural dynamics at the trial-by-trial level using only two variables (drift rate and classifier uncertainty). This approach allows us to directly compare model and human results.”
2. Provide an explanation for the (order of magnitude) weaker association between classier uncertainty and drift rate (by participants) for human participants (Figure 4B), and the weak reaction time effects in Supp. Figure 2.
This is an excellent point. We agree that the difference in magnitude of effects from model to data is important. There are four reasons that we observe a greater magnitude of effect in the simulated results.
First, the simulated data aren’t affected by the same sources of noise as the human data. Our model focuses on the CBGT circuit in isolation, using restricted cell types, deterministic firing properties, and a simple mapping between information and firing rate. The human data, by comparison, reflects a macroscopic proxy of underlying neural dynamics (i.e., hemodynamic response) from much larger and heterogeneous cell populations, with an indirect mapping between neural activity and signal (i.e., neurovascular coupling), and a strong autocorrelation structure to the noise in the hemodynamic signal itself. This adds in substantially more variability that would, expectedly, attenuate the magnitude of any effects in the human data.
Second, and building off of our prior point, our computational model isn’t susceptible to other non-task related variance, like level of fatigue, an attentional lapse, etc. that the humans likely experience. In fact, the MRI magnet is a less than ideal testing environment for many cognitive tasks, which can add substantial variance to behavior. Our model did not have these same contextual influences.
Third, and crucially, we only used this model to predict the associations we would see in humans. Using human data to fine-tune the model would invert this logic, compromising the independence of the prediction by allowing information from the empirical data to leak into the prediction. So, given that we wanted to truly test our predicted results and that fine-tuning would result in circular inference, we compare the qualitative patterns of human and model results.
Fourth, and finally, the simulations only used a single experimental condition and the frequency of a shift in the statistically optimal option (volatility) was deterministic, leading to cleaner results. Our human experiments varied the relative value of the two options (conflict) and volatility for a total of nine experimental conditions per subject (Figure 3 Figure Supp. 2). Importantly, these manipulations are stochastic, so that although all participants went through conditions with the same statistical features, no two participants experienced the same specific experimental conditions at the trial-by-trial level.
Altogether, these factors increase the variance of human responses, meaning we have more information to work with, but decreased precision. Because of this, our goal was to compare the qualitative pattern of results for the model and the humans. Nonetheless, we have clarified the reasons for this discrepancy in magnitude in the Discussion section of the revised manuscript to make these issues clear:
“Careful attention to the effect size of our correlations between channel competition and drift rate shows that the effect is substantially smaller in humans than in the model. This is not surprising and due to several factors. Firstly, the simulated data is not affected by the same sources of noise as the hemodynamic signal, whose responses can be greatly influenced by factors such as heterogeneity of cell populations and properties of underlying neurovascular coupling. Additionally, our model is not susceptible to non-task related variance, such as fatigue or lapses of attention, which the humans likely experienced. We could have fine tuned the model results based on the empirical human data, but that would contaminate the independence of our predictions. Finally, our simulations only used a single experimental condition, whereas human experiments varied the relative value of options and volatility, which led to more variance in human responses. Yet, despite these differences we see qualitative similarities in both the model and human results, providing confirmation of a key aspect of our theory.”
3. Discuss why the model's cortical neurons had no contralateral encoding, unlike in the neuroimaging data.
The reviewer brings up an important clarification that is needed about our modeling decisions. Our model of the CBGT pathways uses a simplified design of isolated “action channels”, which are generally defined as separable populations representing unique actions (e.g., left or right hand responses) (Mink, 1996). So our model is agnostic as to the true laterality of representations in the brain, so long as they are relatively distinct representations. This is, in fact, what we see in our human neuroimaging data. Neural representations of left and right actions are distinct and they compete (Figure 3C; Figure 3 Figure Supp. 4).
Indeed, the lateralization of unimanual actions is complicated in reality, with more bilateral representations for left hand actions than right hand actions (e.g., Verstynen et al. 2005). So long as the populations representing the action are unique, regardless of hemisphere, our underlying model assumptions hold.
We now clarify this point in the main text:
“A critical assumption of the canonical model is that the basal ganglia are organized into multiple "channels", mapped to specific action representations, each containing a direct and indirect pathway. It is important to note that, for the sake of parsimony, we adopt a simple and canonical model of CBGT pathways, with action channels that are agnostic as to the location of representations (e.g., lateralization), simply assuming that actions have unique population-level representations.”
4. Change of mind in the literature is now more linked to within trial change in (impending) choices, a more recent research area (e.g. Result et al., Nat. 2009), and the phrase change of mind is not as suitable for use in this work. I would replace such phrases with phrases like adaptive decision/choice (learned over trials) or similar.
We are happy to minimize confusion with this other research area. We now refer to a change of mind as flexible decision-making, as in the abstract:
“Adapting to a changing world requires flexible decisions. Previously, we showed how the evidence accumulation process driving decisions shifts when outcome contingencies change. […]”
5. Supp. Figure 4. It would have been clearer to show the activity dynamics over time for the key brain regions, e.g. with fast and slow decisions. Is there actually ramping of activity over time? Could brain regions linked to dopaminergic activity be obtained and related to that in model simulations?
See our reply to comment #1 above. Given the timing of the trials, relative to the lag and auto-correlational structure of the BOLD response, this analysis is unlikely to yield anything productive because the entire trial is subsumed under a single evoked response. Our results here are based on variation in magnitude of the evoked response. While we are sympathetic to this question, and indeed this is the goal of follow up work with neurophysiological recordings in rodents, the limitations of the fMRI signal restrict our resolution for evaluating these sorts of intra-trial dynamics.
6. Supp. Figure 5A. Why are the weights for GPi so strong, but not much in humans?
The reason for this is again due to the limitations of the BOLD response. The pallidum is heavy in iron, which substantially impacts the signal-to-noise for detecting blood oxygenation changes in the hemodynamic signal. In addition, the primary synaptic inputs into the pallidum are GABAergic. It is still somewhat controversial as to whether and how the BOLD response is sensitive to GABAergic activity. This fundamentally limits what we can resolve with the hemodyamic response in this area.
7. Supp. Table 1. Why is the accuracy so low, hovering around the chance level?
This was a dynamic task in which the best option changed probabilistically. This means that participants had to switch their responses, necessarily resulting in errors as they adapt to the new environmental contingencies. The reviewer is right – a summary statistic is likely not the best measure. We have removed that table. We now show the average evoked accuracy and RT, following the change point as the comparison.
8. Lines 470-471. Is there any non-decision latency (e.g. signal transduction and motor preparation) to bridge from decision time to reaction time?
Yes, the hierarchical drift diffusion modeling (HDDM) framework incorporates a specific estimate of non-decision influences on reaction time, known as ‘non-decision time’ (tr). This is accounted for as a static parameter in our HDDM fits.
9. Lines 604-605. The use of the classifier LASSO-PCR was not justified.
Our approach was based on prior work showing the utility of the method for whole-brain decoding (e.g. Rasero et al. 2021, Wager et al. 2011). The basic problem is that the statistical model is very high dimensional, with many more voxels than trials. So the combination of dimensionality reduction and sparsity constraints helps to reign in the complexity of the model. The beauty of the LASSO-PCR approach is that it effectively handles high model dimensionality while allowing for clear interpretability (as opposed to methods like random forests or support vector machines, which are more difficult to make mechanistic inferences from).
But the reviewer raises an interesting point. We have rerun our neuroimaging and simulation analysis without LASSO regularization for comparison (i.e., using only the dimensionality of a PCR model). The prediction accuracy and ROC curves for the models are shown in Author response image 1, with the regularized results shown in Figure 3.
Author response image 1
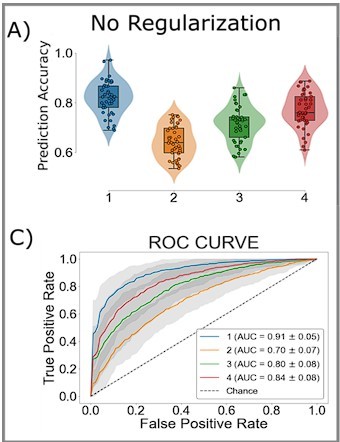
Looking at the hold out accuracies, regularization does improve choice prediction, with the regularized model ~1.2 times as likely to correctly classify an action. However, this effect was small (z=1.917, p=0.055).Nonetheless this is an important point. We have added further justification of our analysis choice to the Methods and the Results:
Results:
“The choice of LASSO-PCR was based on prior work building reliable classifiers from whole-brain evoked responses that maximizes inferential utility (see Wager et al. 2011). The method is used when models are over-parameterized, as when there are more voxels than observations, relying on a combination of dimensionality reduction and sparsity constraints to find the true, effective complexity of a given model. While these are not considerations with our network model, they are with the human validation experiment that we describe next. Thus we used the same classifier on our model as on our human participants to directly compare theoretical predictions and empirical observations.”
Methods:
“A Lasso-PCR classifier (i.e. an L1-constrained principal component logistic regression) was estimated for each participant according to the below procedure. We should note that the choice of LASSO-PCR was based on prior work (see Wager et al. 2011). This approach is used in case of over-parameterization, as when there are more voxels than observations, and relies on a combination of dimensionality reduction and sparsity constraints to find the effective complexity of a model.”
Reviewer #2 (Recommendations for the authors):
I will focus mostly on the behavioral task and HDDM model, as well as the link between behavior and the in silico model. My expertise does not lie in evaluating the details of the spiking neural network model, or the processing of fMRI data.
Specific questions:
– One methodological concern/clarification: the correlation between drift and model uncertainty (figure 2E) and drift and fMRI classifier uncertainty (figure 4B) seems the crucial test of the similarity between brain, behavior, and model. However, drift is not usually fit on a single trial level. So, I think the distributions shown are the posteriors from the HDDM regression model.
We agree that this was not clear. Figures 2E and 4B show bootstrapped distributions of the association test (Β weight) between classifier uncertainty and drift rate, not the HDDM posteriors. We now clarify this in the figure captions for 2E and 4B:
2E: “Bootstrapped estimates of the association between classifier uncertainty and drift rate. […]“.
4B: “Bootstrapped estimates of the association […]”.
– But if so, should the spiking NN model + the fMRI results not be compared to a simpler null model (e.g. with a weighted average of past responses) to know how much it's an improvement over previous work?
This is a correct assumption indeed. In fact, we have compared all pairwise variants of the HDDM model (i.e., an array of comparison hypotheses), along with a more rigid null model predicting average responses (Supp. Files 1 and 2). The drift-rate model shows the best fit to the observed data among this full set of model comparisons. We now make this clearer in the main text (Results):
“We compared models where single parameters changed in response to a switch, pairwise models where both parameters changed, and a null model that predicts no change in decision policy (Supp. Table 2, Supp. Table 3).”
However, we will admit that we did not compare the central linking hypothesis (between behavior, decision policies, and implementation systems) that is key to our central claim in the paper. To test an alternative linking hypothesis, we conducted the same analysis using boundary height as our target variable associated with classifier uncertainty in humans. We have previously shown that this parameter also adapts in response to a change in outcome uncertainty (Bond et al. 2021). Overall, this parameter fails to show an association with classifier uncertainty overall and in all but one subject, who has a weak positive association. Comparing this effect to the stronger effect association between classifier uncertainty and drift rate presents a more severe test of our primary hypothesis.
We now show the evoked response and association test for this new analysis in the supplemental materials (Figure 4 – Figure Supp. 1).
– A block switch every 10 trials seems very easy to learn (i.e. simply by counting). Did any of the four humans take this strategy?
Thank you for pointing out a lack of clarity in our design description. It is correct that a predictable change would lead to a simple strategy for humans to adopt. In order to avoid this the imposed block switches were generated using a Poisson distribution, so they were stochastic with an average rate ranging from 10 to 30 trials, depending on the testing session.
We can see where this confusion arose, given that we did not have this concern in our simple model (which does not have these sort of anticipatory mechanisms) which we described before the human data. We now clarify the difference in task design between model and human experiments in the Results:
“The experimental task followed the same general structure as our prior work (Bond et al. 2021), with the exception that block switches were deterministic for the model, happening every 10 trials, whereas in actual experiments they are generated probabilistically so as to increase the uncertainty of participant expectations of the timing of outcome switches.”
– I'm a bit puzzled the prediction of CBGT network choices (lines 130-131) is not 100%, since presumably all the relevant information (firing rates of all regions modelled) together should perfectly predict the choice. How crucial is the choice of the LASSO-PCR classifier (over other classifiers)?
Regarding the classifier’s accuracy on the CBGT model, we should point out that this was a probabilistic decision-making task. If the optimal choice is rewarded 75% of the time, we set the other choice as 25% rewarded. This means that selecting the statistically optimal choice 100% of the time would result in an accuracy ceiling of 75%. But, more importantly, this is highlighting what appears to be a bug, but is in fact a feature. Indeed, the fact that the classifier is not at 100% is exactly what we would expect if the network experiences decision uncertainty. This variance is harvested to evaluate our primary hypothesis about uncertainty across action channels and drift rate in the decision process.
As for the second point regarding choice of classifier, the LASSO-PCR approach is a common classifier approach used for building whole brain classifiers (Rasero et al. 2021, Wager et al. 2011). It was specifically designed as a conservative approach to overcoming high model complexity without overfitting and is, by design, an ultra-conservative approach. We could have tried other machine learning approaches for handling high data complexity, but many of these are “black box” approaches that make interpretability more difficult. We could re-run our analysis with ridge regression or elastic net combined with PCR, but these choices are unlikely to change the overall conclusions of the finding because the complete independence of each principal component means that ridge and lasso would converge on largely the same solutions.
But the reviewer is right, that we did not vet the necessity for the double constraint for model complexity. We have run a follow-up analysis on both the model and neuroimaging data without the LASSO regularization step. This largely produced the same accuracy as our model with LASSO penalties. See item 4 for Reviewer #1 under minor concerns for a figure comparing the prediction accuracy and ROC curve for our results with and without regularization.
Given that the choice in classifier parameters does not have a large impact on the results, we have opted to keep the more conservative LASSO-PCR model. We feel that a vetting of different classifier models would shift the focus of the paper to an engineering question (i.e.- maximizing classifier accuracy), rather than the hypothesis-driven focus that drives the current study. However, our data and code are completely publicly available for follow up comparisons of classifier models for predicting human choices. We strongly encourage anyone interested in this follow up question to use these freely.
We now add further justification of our analysis choice to the Methods and the Results, as shown in item 24 of the Minor section for Reviewer #1.
References
Bond, K., Dunovan, K., Porter, A., Rubin, J. E., and Verstynen, T. (2021). Dynamic decision policy reconfiguration under outcome uncertainty. ELife, 10, e65540.
Mink, J. W. (1996). The basal ganglia: focused selection and inhibition of competing motor programs. Progress in neurobiology, 50(4), 381-425.
Rasero, J., Sentis, A. I., Yeh, F. C., and Verstynen, T. (2021). Integrating across neuroimaging modalities boosts prediction accuracy of cognitive ability. PLoS computational biology, 17(3), e1008347.
Verstynen, T., Diedrichsen, J., Albert, N., Aparicio, P., and Ivry, R. B. (2005). Ipsilateral motor cortex activity during unimanual hand movements relates to task complexity. Journal of neurophysiology, 93(3), 1209-1222.
Wager, T. D., Atlas, L. Y., Leotti, L. A., and Rilling, J. K. (2011). Predicting individual differences in placebo analgesia: contributions of brain activity during anticipation and pain experience. Journal of Neuroscience, 31(2), 439-452.
[Editors’ note: what follows is the authors’ response to the second round of review.]
We appreciate your efforts in trying to address the reviewers' points. While the reviewers were satisfied with several of your responses, there are remaining issues. Most importantly, both reviewers felt that the study, while useful, appears a bit preliminary and the evidence in support of your conclusions remains incomplete.
Reviewer #1 (Recommendations for the authors):
The overall responses from the authors were mainly satisfactory, but further concerns remain.
1. Perhaps the authors can replace the spiking neural network model with simpler network-RL-based theoretical models that are more suitably linked and optimised to BOLD-fMRI data or remove the spiking neural network model which can be used and validated in their subsequent future work based on more precise neural recording.
We see why the reviewer thinks a more abstracted model would be appropriate here, given the overall degrees of freedom in the spiking model. The parsimony afforded by more abstracted networks would make the problem easier, however, it does not necessarily make the approach more truth-conducive. Rate-based models are largely abstracted and substantially reduce the ability to map to microscale data, as well as capture nuances of the macroscale observations. Had we produced an unreliable result or an inconsistent mapping between the model and empirical data, we could understand the need to “optimize” by moving to a simpler network model. However, here we have a biologically realistic model of a well-described set of pathways that makes an explicit (and accurate) prediction of neuro-behavioral data that we can validate empirically. This removes the need to optimize by moving to a more abstracted model that reduces our ability to map to microscale observations (something we are currently finishing in rodents at the time of this letter). Put another way, would a better match to our empirical data using a rate-based network fundamentally change the conclusions drawn? We do not see how this would. Therefore we have opted to stick with the rate-based network (but see next point).
2. Both CBGT and DDMs' parameters did not seem to be optimised. The authors' justification is that model optimisation based on experimental data could lead to 'circular' inference. Although I can understand this to some extent, especially with physiologically constrained model, I am not sure whether I fully agree with this claim. In any case, the authors should at least summarise clearly which CBGT and DDM parameters were free, which were constrained, and which were tuned – a summary table may help.
We can see why some might come to this conclusion, however, this is not exactly correct. The CBGT network parameters were optimized to produce biologically realistic firing rates. A substantial amount of (unstated) work went into finding algorithms to search the subspace of parameters to produce reasonable physiological and behavioral effects with this network. On the flip side, the DDM parameters were fit to empirical data (both from the network model and human behavior). So they are, by definition, optimized. Note also that in the prior revision we conducted a full model comparison, selecting the model that best explained the observed data according to well-accepted information loss metrics. Free parameters were limited to drift rate and boundary height. The structure of these models is specified in Supplementary Files 1 and 2, both for group-level and participant-by-participant analyses.
Now, it is possible that we just happened to land on a set of CBGT network parameters that produced the hypothesized effects we were searching for. Given the complexity of these sorts of models, this is a reasonable concern. We addressed this in the revision using a simple robustness test of the CBGT network, wherein we varied the parameter schemes within biologically plausible limits and performed the same key analyses as with the previous network configuration. Specifically we chose two more network configurations that produce faster and slower response times (maintaining biological constraints in the firing rates). Overall, we find that the key pattern we observed previously – a reciprocal relationship between drift rate and classifier accuracy – was replicated regardless of parameter scheme. We now include this in the Results section and with supplementary figures (Figure 1 —figure supplements 1 and 2; Figure 2 Figure Supplement 1).
“Next, in order to rule out the possibility that these adaptive network effects emerged due to the specific parameter scheme that we used for the simulations, we re-ran our simulations using different parameter schemes. For this we used a constrained sampling procedure (see Vich et al. 2022) to sample a range of different networks with varying degrees of speed and accuracy. This parameter search was constrained to permit regimes that result in biologically realistic firing rates (Figure 1 —figure supplement 1). The simulations above arose from a parameter scheme lying in the middle of this response speed distribution (Intermediate). We then chose two parameter regimes, one that produces response speeds in the upper quartile of the distribution (Slow) and one that produces response speeds in the lower quartile (Fast; Figure 1 —figure supplement 2A and 2B.). We repeated the simulation experiments with these new more ”extreme” networks. As expected, our general classifier accuracy held across the range of regimes, with comparable performance across all three model types (Figure 1 —figure supplement 2C). In addition, the reciprocal relationship between classifier uncertainty and v were replicated in the Fast and Slow networks (Figure 2 —figure supplement 1A), with the Fast network showing a more expansive dynamic range of drift rates than the Intermediate or Slow networks. When we look at the correlation between classifier uncertainty and v, we again see a consistent negative association across parameter regimes (Figure 2 —figure supplement 1B). The variability of this effect increases when networks have faster response times, suggesting that certain parameter regimes increase overall behavioral variability. Despite this, our key simulation effects appear to be robust to variation in parameter scheme.”
Overall, this work is interesting and could potentially contribute to the computational modelling and neuroscience of adaptive choice behaviour. However, a major component of the work, on the CBGT modelling, seems somewhat premature.
Reviewer #2 (Recommendations for the authors):
I thank the authors for clarifying various technical details.
While this is solid work, I am still unsure as to the main insights we can draw from this paper itself. The main argument for using the fine-scale model to account for fMRI data is that it sets the stage for future work, which will compare these model predictions with mouse data. As much as I understand that this is how science goes, the result for this paper is that linking fMRI and the detailed model is a bit strange (and makes it much harder to draw conclusions from). For the general readership of eLife, I'm not sure if the current insights are very helpful before knowing the results of the more fine-grained data that are currently being collected.
We can see where the reviewer is coming from, however, we respectfully disagree. The computational model makes very specific predictions based on the logic of the biological circuit. This is used in a generative framing approach, where the model predicts and data validates (or does not). This approach has been used many times before, including in published work at eLife:
Scheinost, D., Noble, S., Horien, C., Greene, A. S., Lake, E. M., Salehi, M., … and Constable, R. T. (2019). Ten simple rules for predictive modeling of individual differences in neuroimaging. Neuroimage, 193, 35-45.
Franklin, N. T., and Frank, M. J. (2015). A cholinergic feedback circuit to regulate striatal population uncertainty and optimize reinforcement learning. ELife, 4, e12029.
Schirner, M., McIntosh, A. R., Jirsa, V., Deco, G., and Ritter, P. (2018). Inferring multi-scale neural mechanisms with brain network modelling. eLife, 7, e28927.
We now include clarity on this generative modeling approach, and its links to prior work, in the manuscript.
Introduction:
“Here we adopt a generative modeling approach to investigate the underlying neural mechanisms that drive dynamic decision policies in a changing environment. We start with a set of theoretical experiments, using biologically realistic spiking network models, to test how competition within the cortico-basal ganglia-thalamic (CBGT) circuits influences the evidence accumulation process (Dunovan and Verstynen 2019, Bariselli et al. 2018, Mikhael and Bogacz 2016, Rubin et al. 2020, and Yartsev et al. 2018). Our choice of model, over simple abstracted network models (e.g.,rate-based networks), reflects an approach designed to capture both microscale and macroscale dynamics, allowing for the same model to bridge observations across multiple levels of analysis (see also Scheinost et al. 2019, Schirner et al. 2018, and Franklin and Frank 2015).”
Results:
“To simulate this process, we designed a spiking neural network model of the CBGT circuits, shown in Figure 1A, with dopamine-dependent plasticity occurring at the corticostriatal synapses (Rubin et al. 2020, Vich et al. 2020). Critically, although this model simulates dynamics that happen on a microscale, it can be mapped upwards to infer macroscale properties, like inter-region dynamics and complex behavior, making it a useful theoretical tool for bridging across levels of analysis.”
We also add a reference to our approach in the abstract:
“Making adaptive choices in dynamic environments requires flexible decision policies. Previously, we showed how shifts in outcome contingency change the evidence accumulation process that determines decision policies (Bond et al. 2021). Using in silico experiments to generate predictions, here we show how the cortico-basal ganglia-thalamic (CBGT) circuits can feasibly implement shifts in decision policies.”
We also now include a detailed discussion on the limitations of our modeling approach, focusing on critical assumptions of the model that may impact its predictions. This has been added to the Discussion.
“It is important to point out that there are critical assumptions in our model that might impact how the results can be interpreted. For example, we are assuming a strict action channel organization of CBGT pathways (Mink 1996). Realistically action representations in these networks are not as rigid, and there may be overlaps in these representations (see Klaus et al. 2017). However, by restricting our responses to fingers on opposite hands, it is reasonable to assume that the underlying CBGT networks that regulate selecting the two actions are largely independent. Another critical assumption of our model is the simple gating mechanism from the thalamus, where actions get triggered once thalamic firing crosses a specified threshold. In reality, the dynamics of thalamic gating are likely more complicated (Logiaco, Abbott, and Escola 2021) and the nuance of this process could impact network behavior and subsequent predictions. Until the field has a better understanding of the process of gating actions, our simple threshold model, although incomplete, remains useful for generating simple behavioral predictions. These assumptions may limit some of the nuance of the predicted brain-behavior associations, however, they likely have little impact on the main prediction that competition in action representations tracks with the rate of evidence accumulation during decision making.”
Finally, the concern about model complexity is the concern of overparameterization. This would be a significant problem if we were fitting behavioral/neural data to the model. But we are not doing that here. However, to show the robustness of the effects, we now include a broader range of simulations, with different parameter schemes, that show how resilient the predictions are to different network configurations [see reply to Reviewer #1, Comment #2].
https://doi.org/10.7554/eLife.85223.sa2Article and author information
Author details
Funding
Air Force Research Laboratory (180119)
- Timothy Verstynen
National Institutes of Health (CRCNS: R01DA053014)
- Timothy Verstynen
The funders had no role in study design, data collection and interpretation, or the decision to submit the work for publication.
Acknowledgements
We thank all members of the CoAx Lab and collaborators for their feedback on the development of this work. This work was funded by the Air Force Research Laboratory, Grant Reference Number FA9550-18-1-0251 and NIH award R01DA053014 as part of the CRCNS program. All neuroimaging data were collected at the Carnegie Mellon-University of Pittsburgh Brain Imaging, Data Generation, and Education Center (RRID:SCR 023356).
Ethics
All procedures were approved by the Carnegie Mellon University Institutional Review Board (Approval Code: 2018_00000195). All research participants provided informed consent to participate in the study and consent to publish any research findings based on their provided data.
Senior Editor
- Floris P de Lange, Donders Institute for Brain, Cognition and Behaviour, Netherlands
Reviewing Editor
- Tobias H Donner, University Medical Center Hamburg-Eppendorf, Germany
Version history
- Preprint posted: October 6, 2022 (view preprint)
- Received: November 30, 2022
- Accepted: October 10, 2023
- Accepted Manuscript published: October 11, 2023 (version 1)
- Version of Record published: November 3, 2023 (version 2)
Copyright
© 2023, Bond et al.
This article is distributed under the terms of the Creative Commons Attribution License, which permits unrestricted use and redistribution provided that the original author and source are credited.
Metrics
-
- 426
- Page views
-
- 64
- Downloads
-
- 1
- Citations
Article citation count generated by polling the highest count across the following sources: PubMed Central, Crossref, Scopus.
Download links
A two-part list of links to download the article, or parts of the article, in various formats.
Downloads (link to download the article as PDF)
Open citations (links to open the citations from this article in various online reference manager services)
Cite this article (links to download the citations from this article in formats compatible with various reference manager tools)
Competing neural representations of choice shape evidence accumulation in humans
eLife 12:e85223.
https://doi.org/10.7554/eLife.85223
Further reading
-
- Neuroscience
Medial frontal cortical areas are thought to play a critical role in the brain’s ability to flexibly deploy strategies that are effective in complex settings, yet the underlying circuit computations remain unclear. Here, by examining neural ensemble activity in male rats that sample different strategies in a self-guided search for latent task structure, we observe robust tracking during strategy execution of a summary statistic for that strategy in recent behavioral history by the anterior cingulate cortex (ACC), especially by an area homologous to primate area 32D. Using the simplest summary statistic – strategy prevalence in the last 20 choices – we find that its encoding in the ACC during strategy execution is wide-scale, independent of reward delivery, and persists through a substantial ensemble reorganization that accompanies changes in global context. We further demonstrate that the tracking of reward by the ACC ensemble is also strategy-specific, but that reward prevalence is insufficient to explain the observed activity modulation during strategy execution. Our findings argue that ACC ensemble dynamics is structured by a summary statistic of recent behavioral choices, raising the possibility that ACC plays a role in estimating – through statistical learning – which actions promote the occurrence of events in the environment.
-
- Neuroscience
Postsynaptic mitochondria are critical for the development, plasticity, and maintenance of synaptic inputs. However, their relationship to synaptic structure and functional activity is unknown. We examined a correlative dataset from ferret visual cortex with in vivo two-photon calcium imaging of dendritic spines during visual stimulation and electron microscopy reconstructions of spine ultrastructure, investigating mitochondrial abundance near functionally and structurally characterized spines. Surprisingly, we found no correlation to structural measures of synaptic strength. Instead, we found that mitochondria are positioned near spines with orientation preferences that are dissimilar to the somatic preference. Additionally, we found that mitochondria are positioned near groups of spines with heterogeneous orientation preferences. For a subset of spines with a mitochondrion in the head or neck, synapses were larger and exhibited greater selectivity to visual stimuli than those without a mitochondrion. Our data suggest mitochondria are not necessarily positioned to support the energy needs of strong spines, but rather support the structurally and functionally diverse inputs innervating the basal dendrites of cortical neurons.


