Down the Penrose stairs, or how selection for fewer recombination hotspots maintains their existence
- Department of Systems Biology, Columbia University, United States
- Department of Biological Sciences, Columbia University, United States
- Program for Mathematical Genomics, Columbia University, United States
Abstract
In many species, meiotic recombination events tend to occur in narrow intervals of the genome, known as hotspots. In humans and mice, double strand break (DSB) hotspot locations are determined by the DNA-binding specificity of the zinc finger array of the PRDM9 protein, which is rapidly evolving at residues in contact with DNA. Previous models explained this rapid evolution in terms of the need to restore PRDM9 binding sites lost to gene conversion over time, under the assumption that more PRDM9 binding always leads to more DSBs. This assumption, however, does not align with current evidence. Recent experimental work indicates that PRDM9 binding on both homologs facilitates DSB repair, and that the absence of sufficient symmetric binding disrupts meiosis. We therefore consider an alternative hypothesis: that rapid PRDM9 evolution is driven by the need to restore symmetric binding because of its role in coupling DSB formation and efficient repair. To this end, we model the evolution of PRDM9 from first principles: from its binding dynamics to the population genetic processes that govern the evolution of the zinc finger array and its binding sites. We show that the loss of a small number of strong binding sites leads to the use of a greater number of weaker ones, resulting in a sharp reduction in symmetric binding and favoring new PRDM9 alleles that restore the use of a smaller set of strong binding sites. This decrease, in turn, drives rapid PRDM9 evolutionary turnover. Our results therefore suggest that the advantage of new PRDM9 alleles is in limiting the number of binding sites used effectively, rather than in increasing net PRDM9 binding. By extension, our model suggests that the evolutionary advantage of hotspots may have been to increase the efficiency of DSB repair and/or homolog pairing.
Editor's evaluation
This paper presents a theoretical model of the evolutionary dynamics of Prdm9-dependent meiotic recombination hotspots. This study provides important insights. It shows that selection acts to limit the number of hotspots and to increase hotspot symmetry. This is consistent with the proposed role of PRDM9 in coordinating DSB formation and repair. Although the authors did not explore all possible scenarios, the conclusions are convincing and open up directions for extending the model and testing some of its predictions.
https://doi.org/10.7554/eLife.83769.sa0Introduction
Meiotic recombination is initiated by the deliberate infliction of double strand breaks (DSBs) across the genome and resolved with their subsequent repair using homologous chromosomes. In many species, including all plants, fungi and vertebrates investigated to date, the vast majority of meiotic recombination events localize to narrow intervals of the genome known as hotspots (reviewed in Tock and Henderson, 2018). Why recombination is concentrated in hotspots in some taxa, as opposed to being more uniformly spread across the genome, as in Drosophila (Manzano-Winkler et al., 2013; Smukowski Heil et al., 2015) or C. elegans (Kaur and Rockman, 2014; Bernstein and Rockman, 2016), remains unknown. Moreover, among species with hotspots, there exists a great deal of variation in how hotspots are localized, and it is unclear know why these different mechanisms have been adopted in different lineages.
In humans and mice, and likely many other metazoan species, the primary determinant of hotspot locations is PRDM9 and the DNA-binding specificity of its Cys-2-His-2 Zinc Finger (ZF) array (Myers et al., 2010; Baudat et al., 2010; Parvanov et al., 2010; Baker et al., 2017). Early in meiosis, PRDM9 binds to thousands of binding sites along the genome (Grey et al., 2017; Parvanov et al., 2017), where its PR/SET domain catalyzes the formation of H3K4me3 and H3K36me3 marks on nearby histones (Hayashi et al., 2005; Grey et al., 2011; Wu et al., 2013; Eram et al., 2014; Powers et al., 2016). These marks, and protein interactions mediated by the PRDM9 KRAB domain, play a role in bringing PRDM9-bound sites to the chromosomal axis, where the SPO11 protein catalyzes the formation of DSBs at a small subset (Imai et al., 2017; Parvanov et al., 2017; Diagouraga et al., 2018; Thibault-Sennett et al., 2018; Bhattacharyya et al., 2019).
Whereas in species lacking PRDM9, such as canids, birds, fungi and plants, recombination rates are increased near promoter-like features, such as transcriptional start sites or CpG islands (Auton et al., 2013; Singhal et al., 2015; Lam and Keeney, 2015; Yelina et al., 2015) and the recombination landscape is conserved over tens of millions of years (Singhal et al., 2015; Lam and Keeney, 2015), in species that use PRDM9 to direct recombination, recombination rates are not elevated near such features and the recombination landscape is rapidly-evolving. Notably, the hotspots used in closely related species, such as humans and chimpanzees, or even different subspecies, show no more overlap than expected by chance (Ptak et al., 2004; Winckler et al., 2005; Auton et al., 2012; Brick et al., 2012; Stevison et al., 2016).
This rapid evolution of PRDM9 mediated recombination is driven by both the evolutionary erosion of PRDM9 binding sites due to gene conversion (GC) and concomitant turnover in the DNA-binding specificity of PRDM9’s ZF-array. When individuals are heterozygous for ‘hot’ and ‘cold’ alleles, defined as those more or less likely to experience a DSB during meiosis, GC leads to the under-transmission of hot alleles in a manner that is mathematically analogous to purifying selection against them (Nagylaki and Petes, 1982; Jeffreys and Neumann, 2002). This phenomenon is observed in the over-transmission of polymorphisms disrupting PRDM9 binding motifs within hotspots (Berg et al., 2011; Cole et al., 2014). In the absence of any countervailing selective pressures, the under-transmission of hot alleles should lead to their rapid loss from the population over time (Nicolas et al., 1989; Boulton et al., 1997; Pineda-Krch and Redfield, 2005; Coop and Myers, 2007; Peters, 2008); this prediction too is met, in the unusually rapid erosion of PRDM9 binding sites in primate and rodent lineages (Myers et al., 2010; Baker et al., 2015; Smagulova et al., 2016; Spence and Song, 2019).
The use of hotspots persists despite their erosion, owing to evolutionary turnover in the DNA-binding specificity of PRDM9. Variation in hotspot usage has been associated with different PRDM9 alleles (i.e. with different amino acids at the DNA-binding residues of their ZFs) in mice, humans and cattle (Myers et al., 2010; Baudat et al., 2010; Parvanov et al., 2010; Berg et al., 2010; Kong et al., 2010; Berg et al., 2011; Fledel-Alon et al., 2011; Hinch et al., 2011; Sandor et al., 2012; Ma et al., 2015), and the experimental introduction of a PRDM9 allele with a novel ZF-array into mice reprograms the locations of hotspots (Davies et al., 2016). Moreover, strong signatures of positive selection on the DNA-binding residues of ZFs from PRDM9 genes suggests a rapid turnover of PRDM9 binding specificity driven by recurrent selection for novel binding specificities (Oliver et al., 2009; Thomas et al., 2009; Myers et al., 2010; Buard et al., 2014; Baker et al., 2017).
Several theoretical models have been developed in order to explain the co-evolution of PRDM9 and its binding sites (Ubeda and Wilkins, 2011; Latrille et al., 2017). In these models, GC acts to remove PRDM9 binding sites over time, leading to a proportional reduction in the amount of PRDM9 bound and consequently of DSBs or crossovers (COs). These models further assume that having too few DSBs or COs reduces fitness, potentially because at least one CO is required per chromosome for proper disjunction. In these models, therefore, the persistence of hotspots is mediated by a Red Queen dynamic, in which younger PRDM9 alleles are favored over older ones because their binding sites have experienced less erosion due to GC.
The argument that new PRDM9 alleles are favored because they restore PRDM9 binding seems at odds with the nature of hotspots, namely the use of only a small proportion of the genome for recombination. In the extreme, if selection simply favored PRDM9 alleles with a greater number of binding sites, an optimal PRDM9 allele would be one that can bind anywhere in the genome, at which point the heats of individual binding sites would be so diluted as to no longer be hotspots.
Moreover, multiple lines of evidence suggest that in fact, the loss of PRDM9 binding sites does not imperil the initiation of recombination events and only alters their locations. PRDM9-bound sites appear to compete for DSBs (Diagouraga et al., 2018) and the number of DSBs formed per meiosis is tightly regulated independently of PRDM9 (Kauppi et al., 2013; Yamada et al., 2017). Similar numbers of DSBs form even in PRDM9-/- mice (Hayashi et al., 2005; Brick et al., 2012; Mihola et al., 2019) and in a PRDM9-/- human female (Narasimhan et al., 2016); in both cases, the localization of DSB appear to ‘default’ to those found of species lacking PRDM9. Importantly, PRDM9 binding sites themselves are known to compete for available PRDM9 molecules, such that the loss of binding sites may only weakly affect the number bound (Billings et al., 2013; Baker et al., 2014). If the loss of PRDM9-mediated hotspots does not imperil the initiation of recombination then why are new PRDM9 alleles that restore them favored in evolution?
In addition to localizing DSBs, PRDM9 has recently been shown to play a role in DSB repair, mediated by its symmetric recruitment to the same loci on homologous chromosomes during meiosis (Smagulova et al., 2016; Davies et al., 2016; Gregorova et al., 2018; Hinch et al., 2019; Li et al., 2019; Huang et al., 2020; Mahgoub et al., 2020; Wells et al., 2020; Gergelits et al., 2021; Davies et al., 2021). This secondary function was first suggested by studies of hybrid sterility in mice, in which particular crosses result in sterile F1 males (reviewed in Forejt et al., 2021). In these sterile hybrids, the PRDM9 allele of each parental subspecies preferentially binds to the non-parental background, because the strongest PRDM9 binding sites corresponding to the alleles in each parental subspecies have been eroded. The resulting asymmetric binding leads to meiotic arrest in pachytene, associated with widespread delays in DSB repair, asynaptic chromosomes, and defects in homolog pairing (Baker et al., 2015; Smagulova et al., 2016; Davies et al., 2016). Restoring PRDM9 binding symmetry, either through the introduction of a novel PRDM9 allele with functioning binding sites in either parental subspecies (Davies et al., 2016; Davies et al., 2021) or by partially restoring the homozygosity of binding sites on the chromosomes most prone to asynapsis (Gregorova et al., 2018), is sufficient to rescue the fertility of hybrids. These results indicate that fertility depends on having a small number of DSBs at sites symmetrically bound by PRDM9 (Gregorova et al., 2018) on each chromosome.
The importance of DSBs at symmetrically bound sites may be related to them being repaired more rapidly–possibly because symmetric binding reduces the search space during homolog engagement and/or because chromatin modifications create a more accessible substrate for strand invasion–and the preferential use of sites that are repaired early for COs and homolog pairing. Genome-wide analyses indicate that DSBs at asymmetrically-bound hotspots are more likely to experience delays in their repair (Hinch et al., 2019; Li et al., 2019), that they are less likely to result in COs, possibly due to this delay (Hinch et al., 2019), and that they are more likely to be resolved using the sister chromatid rather than the homologous chromosome as a template (Li et al., 2019; Gergelits et al., 2021). Recent work has further implicated the gene ZCWPW1 in mediating efficient repair at symmetrically bound sites (Huang et al., 2020; Mahgoub et al., 2020; Wells et al., 2020). These observations suggest that the selection favoring new PRDM9 alleles stems from the importance of symmetric binding in DSB repair, rather than DSB initiation, as previously envisioned.
In this view, the erosion of the strongest hotspots leads to a decline in symmetrically bound sites because of the competitive binding of PRDM9: the erosion of the few strong binding sites shifts binding toward a greater number of weaker ones, which are much less likely to be bound symmetrically. Based on this premise, we model the co-evolution of PRDM9 and its binding sites from first principles, assuming, as seems realistic, that: (i) the number of DSBs is regulated independently of PRDM9, (ii) PRDM9 binding is competitive between sites (i.e. the availability of PRDM9 is limiting), and (iii) fitness is a function of the probability that the smallest chromosome experiences some minimal number of DSBs at sites symmetrically bound by PRDM9.
Model
Overview
We model the co-evolution of PRDM9 and its binding sites in a diploid, panmictic population of constant size. Individuals are described in terms of their two PRDM9 alleles. Each PRDM9 allele recognizes a distinct set of binding sites, which may have distinct binding affinities or ‘heats’ (i.e. different probabilities of being bound). The model is composed of four main parts (Figure 1). The first describes PRDM9 binding during meiosis in terms of Michaelis-Menten kinetics, in which sites compete for binding their cognate PRDM9 proteins. We use this model to approximate the probability that any given site on the four chromatids (i.e. the four copies of a chromosome present during meiosis) is bound by PRDM9 (Figure 1A). We then approximate the probabilities of any given site experiencing a DSB, and of any given locus experiencing a DSB while being symmetrically bound by PRDM9, that is of a symmetric DSB (Figure 1B).
Figure 1
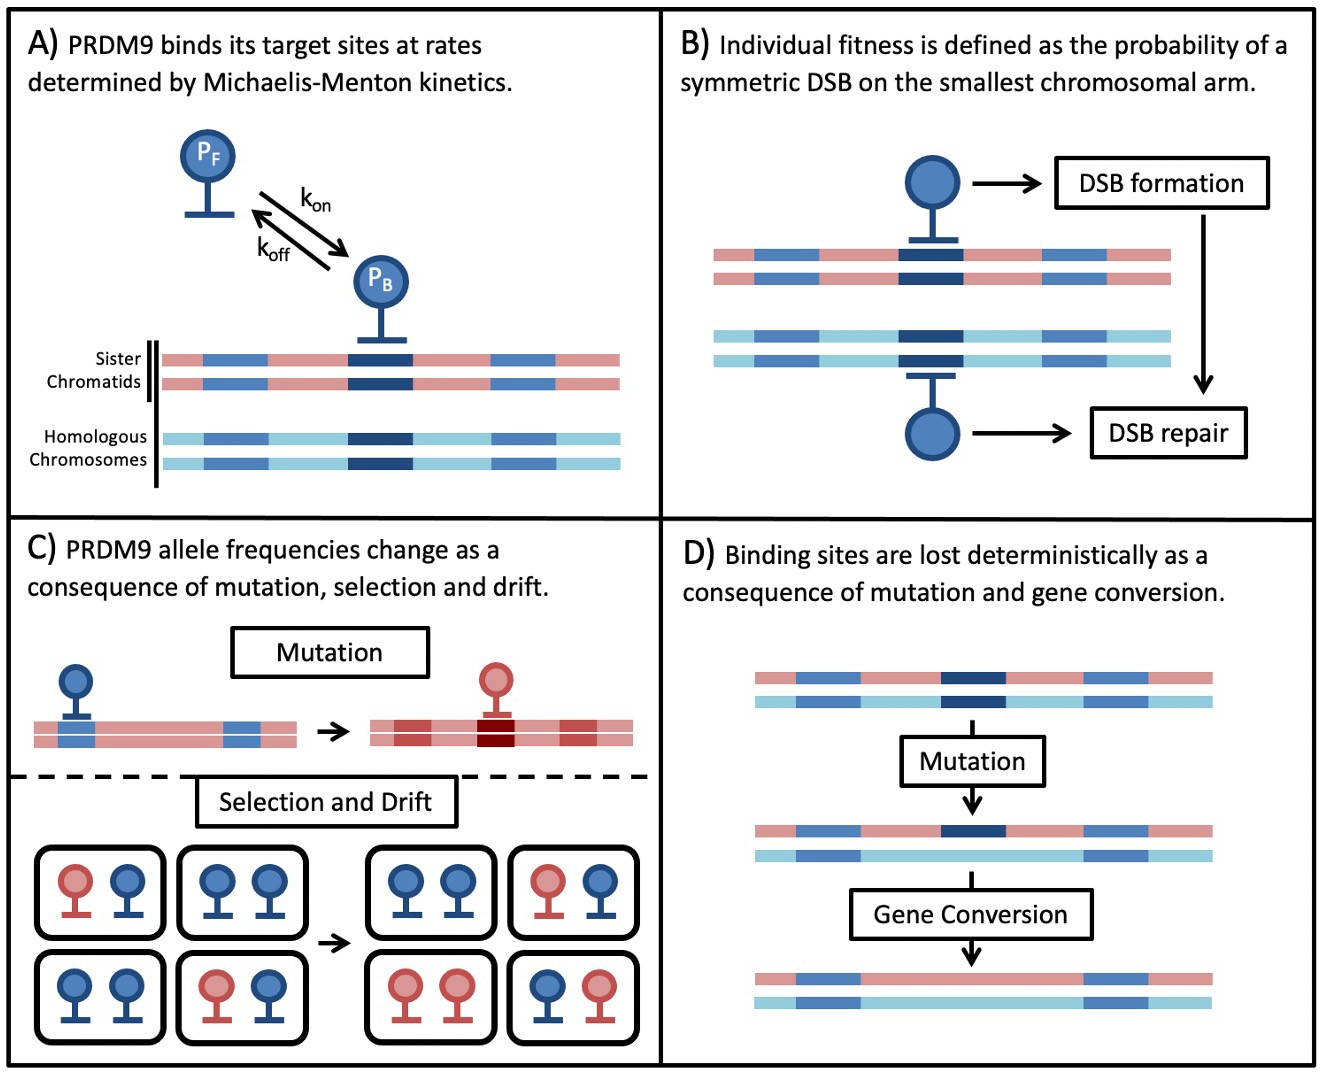
Overview of the Model.
Next, we model the population genetic processes. We use Wright-Fisher sampling with viability selection in a panmictic diploid population of size to describe the change in PRDM9 allele frequencies in the population (Figure 1C). New PRDM9 alleles arise from mutation with probability per individual meiosis and establish a new set of binding sites. Selection on a PRDM9 allele arises from its impact on fitness, and more specifically, the need for at least one symmetric DSB per chromosome per meiosis. For simplicity, we consider only the smallest chromosome because fitness defects arising from asymmetry in PRDM9 binding should affect the smallest chromosomes first (assuming, as seems plausible, that they have fewer sites at which a symmetric DSB might be made). Also for simplicity, we assume that individual fitness is equal to the probability of a symmetric DSB in a single meiosis. In reality, we expect fitness to depend on the proportion of an individual’s gametes that have a sufficient number of symmetric DSBs, but this fitness should be a monotonically increasing function of the probability per meiosis, and therefore we expect the qualitative conclusions to be unchanged. Lastly, we use a deterministic approximation to describe the erosion of binding sites over time (Figure 1D). Mutations that destroy the ability of a site to bind to its cognate PRDM9 are introduced with probability μ per individual meiosis and can fix in the population due to biased gene conversion. The fixation probability depends on rates at which the binding site experiences a DSB and of GC. Below, we describe each part of the model in turn; for a summary of the notation see Table 1.
Table 1
Parameters and variables of the model.
| Parameter | Description | Value |
|---|---|---|
| Diploid population size | 103–106 | |
| μ | Mutation rate from hot to cold alleles at PRDM9 binding sites per generation | 1.25x10⁻⁷ |
| Mutation rate at the PRDM9 locus per generation | 10–5 | |
| Number of DSBs initiated per meiosis | 300 | |
| Total number of PRDM9 molecules expressed per meiosis | 5,000 | |
| Dissociation constant of PRDM9 binding sites with affinity | 5–50 | |
| Probability that a conversion tract spans the PRDM9 binding motif | 0.7 | |
| Proportion of the genome corresponding to the smallest chromosome | 1/40 | |
| Variable | Description | |
| Number of PRDM9 binding sites with affinity , recognized by PRDM9 allele , across the genome | ||
| Probability that a given site with binding affinity , recognized by PRDM9 allele , is bound by PRDM9 in an individual with PRDM9 alleles and (Equation 1) | ||
| Total number of bound cognate PRDM9 molecules in an individual with PRDM9 alleles and | ||
| Number of free cognate PRDM9 molecules in an individual with PRDM9 alleles and per meiosis (Equation 2) | ||
| Probability that any PRDM9-bound site experiences a DSB in an individual with PRDM9 alleles and (Equation 3) | ||
| Probability of a PRDM9 binding site with affinity , recognized by PRDM9 allele , being symmetrically bound by PRDM9 and experiencing a DSB in an individual with PRDM9 alleles and (Equation 4) | ||
| The fitness of an individual with PRDM9 alleles and (Equation 5 for homozygotes, Equation 6 for heterozygotes) | ||
| The marginal fitness of PRDM9 allele across possible genotypes (Equation 7) | ||
| The allele frequency of PRDM9 allele (Equation 8) | ||
| Probability or rate of a PRDM9 binding site with affinity , recognized by PRDM9 allele , experiencing gene conversion spanning the PRDM9 binding motif, in an individual with PRDM9 alleles and (Equation 9) | ||
| Probability or rate of a PRDM9 binding site with affinity , recognized by PRDM9 allele , experiencing gene conversion spanning the PRDM9 binding motif, across the population (Equation 10) | ||
Molecular dynamics of PRDM9 binding
We model the binding of PRDM9 as a consequence of Michaelis-Menten kinetics, wherein binding sites compete for association with a fixed number of PRDM9 molecules. In Appendix 1, we solve these dynamics at equilibrium, that is when the rate at which PRDM9 dissociates from sites with any given binding affinity (‘heat’) is equal to the rate at which PRDM9 binds those sites. Specifically, we show that the heat of a site, that is the probability that a site with binding affinity is bound by PRDM9, can be expressed as
(1)
where () is the site’s dissociation constant and is the number of free PRDM9 molecules. In turn, we show that the expected number of free PRDM9 molecules satisfies the equation
(2)
where is the total number of PRDM9 molecules, is the number of binding affinities, and is the number of sites with affinity , with . When we consider models with one or two types of binding sites, this equation becomes a quadratic or cubic in , respectively, which we solve analytically (see Appendix 1). In the general case, this equation becomes a polynomial of degree , which can be solved numerically.
These equations clarify that the competition among binding sites for PRDM9 molecules is mediated through the number of free PRDM9 molecules, . Equation 2 shows that when the number of binding sites of any given affinity increases, decreases; in turn, Equation 1 shows that when decreases, so the probability of binding any given binding site (). The competition among binding sites is strongest when the bulk of PRDM9 molecules are bound (i.e. ), because any increase in the number of bound sites (due to an increase in their number or affinity) causes a substantial decrease in and thus a decrease in the probability of binding any given binding site.
In turn, the total number of PRDM9 proteins of a given type depends on whether an individual is homozygous or heterozygous for the corresponding PRDM9 allele. We assume that a fixed number of PRDM9 molecules are produced per allele. Consequently, both and the probability of binding of any site () will always be higher in individuals homozygous for the cognate PRDM9 allele than in heterozygotes, and the ratio of heats for sites with different binding affinities will not be the same across genotypes.
The difference in the probability of binding the cognate PRDM9 in homozygotes and heterozygotes and the degree of competition among binding sites will be small when PRDM9 is not limiting (i.e., when ), but can be substantial when PRDM9 is limiting (i.e., when ). Empirical observations suggest that PRDM9 is limiting, with given binding sites bound at substantially greater rates in homozygote individuals than in heterozygotes or hemizygotes (Flachs et al., 2012; Baker et al., 2015); however, the degree to which is it limiting remains unknown and might also vary with, for instance, the age of PRDM9 alleles (see Discussion). In the main case we study below (the ‘two-heat model’), we assume model parameter values for which the bulk of PRDM9 molecules are bound (i.e., ) and thus the competition among binding sites is strongest; this choice simplifies our analysis by reducing the number of parameters that affect the dynamics (see Appendix 3).
Molecular dynamics of DSBs and symmetric DSBs
Next, we approximate the probability that a PRDM9-bound site experiences a DSB in a given meiosis. We assume that the total number of DSBs () is constant and that all PRDM9 bound sites are equally likely to experience a DSB. Thus, if the total number of PRDM9-bound sites in an individual with PRDM9 alleles and is then the probability that a given bound site experiences a DSB is
(3)
This approximation assumes that conditional on being bound, PRDM9 molecules arising from different alleles are equally likely to recruit the DSB machinery, but allows for some degree of dominance as a consequence of differences in the numbers of sites bound by each allelic variant genome-wide. However, in the main case we explore below (the ‘two-heat model’), our assumption that the vast majority of PRDM9 molecules are bound for all alleles results in negligible degrees of dominance arising from differences in genome-wide levels of binding.
In Appendix 2, we show that the probability that a site with binding affinity i experiences a symmetric DSB, that is that at least one of the chromatids is bound by PRDM9 and experiences a DSB and that at least one sister chromatid of each homolog is bound by PRDM9, is
(4)
For clarity, we omit indexes corresponding to the genotype at the PRDM9 locus, which affect through (Equation 3) and through (Equation 2).
Evolutionary dynamics of PRDM9 alleles
We model individual fitness as the probability per meiosis that at least one symmetric DSB occurs on the smallest chromosome, which comprises a proportion of the genome. We make the simplifying assumption that the proportion of binding sites of any affinity found on that chromosome is also , and remains fixed over time; the number of binding sites with binding affinity is therefore . We also assume that the probability of symmetric DSBs at different binding sites are independent (i.e., ignore interference between them). Under these assumptions, we approximate the fitness of a homozygote for PRDM9 allele as 1 minus the probability that none of the binding sites on the smallest chromosome experience a symmetric DSB, that is
(5)
where the product is taken over the possible binding affinities and is the number of binding sites with affinity associated with PRDM9 allele . Similarly, we approximate the fitness of an individual heterozygous for PRDM9, carrying alleles and , as
(6)
The marginal fitness associated with a PRDM9 allele is calculated as a weighted average over genotypic frequencies, in which homozygotes for the focal allele, , are counted twice to account for the two copies of the allele, that is
(7)
where is the frequency of PRDM9 allele . The expected frequencies of allele after viability selection is then given by
(8)
where denotes the population’s mean fitness. These expectations are used in the Wright-Fisher sampling across generations.
Evolutionary dynamics of PRDM9 binding sites
We model the loss of PRDM9 binding sites due to biased gene conversion deterministically. Cold alleles at a binding site arise in the population at a rate of per generation, where is the population size and is the mutation rate from a hot to a cold allele per gamete per generation. Biased gene conversion acts analogously to selection against hot alleles with a selection coefficient equal to the rate of gene conversion fully spanning that binding site, g (Nagylaki and Petes, 1982). Consequently, a newly arisen cold allele (which is never bound by PRDM9) will eventually fix in the population with probability . In turn, we model the probability that a binding site with affinity , recognized by PRDM9 allele experiences gene conversion during a given meiosis in an individual with PRDM9 alleles and as the product of the probabilities that (i) it is bound by PRDM9 () (ii) it experiences a DSB conditional on being bound (), and (iii) the resulting gene conversion spans the binding site (), that is
(9)
The expected population rate of gene conversion at this binding site is the average over individual rates, weighted by genotype frequencies (after viability selection), that is
(10)
We model the fixations of cold alleles as if they occur instantaneously after they arise as mutations, with probabilities that derive from the rate of gene conversion at that time. Thus, we approximate the reduction in the number of binding sites with affinity for PRDM9 allele in a given generation by
(11)
Because we assume that the number of DSBs and thus of gene conversion events per generation is constant, the total rate at which binding sites are lost, across all heats and PRDM9 alleles, is constant, and equals
(12)
Simulations
Simulations of the model were implemented using a custom R script (available at https://github.com/sellalab/PRDM9_model, copy archived at Sellalab, 2023). The simulation keeps track of the frequencies of PRDM9 alleles and of the numbers of binding sites of each considered heat for each allele. Each generation, the simulation calculates the marginal fitness of each PRDM9 allele (Equation 7) and the number of sites of each heat lost due to gene conversion (Equation 11). The frequencies of PRDM9 alleles for the succeeding generation are generated by Wright-Fisher (multinomial) sampling with viability selection (Equation 8). The number of new PRDM9 alleles generated by mutation each generation is sampled from a binomial distribution, where the probability of success is the mutation rate at PRDM9 , and the number of trials is . These mutations are randomly chosen to replace pre-existing PRDM9 alleles (whose frequencies are correspondingly decreased by per new mutation). In every generation, the program records various quantities discussed below, such as the population average fitness or heterozygosity at the PRDM9 locus.
Estimated parameters
Except where stated otherwise, the parameters used in simulations are given in Table 1. The mutation rate from hot to cold alleles is taken to be 1.25x10⁻⁷ per gamete per generation, to reflect a per base pair rate of 1.25x10⁻⁸, as estimated in humans at typical reproductive age (Kong et al., 2012), and ~10 non-degenerate base pairs for PRDM9 binding per binding site, roughly consistent with observed binding motifs in mice and humans (Baudat et al., 2010; Myers et al., 2010). The mutation rate of new PRDM9 alleles is taken to be 10–5 per gamete per generation, based on an estimate in humans (Jeffreys et al., 2013). The number of DSBs per meiosis is set to 300, in light of estimates in both humans and mice (Baudat and de Massy, 2007). In the main text, we set the number of PRDM9 molecules expressed during meiosis is set to 5,000, in line with an estimate of 4,700+/-400 in B6 mice, as inferred from comparing H3K4me3 ChIP-seq DNA at PRDM9-dependent hotspots with MNase treated input DNA (Baker et al., 2014), and roughly consistent with cytological observations of thousands of PRDM9 foci in the nuclei of meiotic cells from mice (Parvanov et al., 2017; Grey et al., 2017), under an assumption that most PRDM9 molecules are bound. Given that the estimate from Baker et al., 2014 plausibly underestimates the amount of bound PRDM9, in Appendix 4, we repeat our main analyses where the number of PRDM9 molecules is set to 500, 1000 and 2500. We set the probability that a gene conversion tract spans the PRDM9 binding motif to 0.7, based on estimates from mice (Li et al., 2019). Lastly, we set the proportion of the genome corresponding to the smallest chromosome to be 1/40, roughly equivalent to that of the smallest chromosome in mice.
Results
Fitness in models with one heat
Our model differs from previous ones (Ubeda and Wilkins, 2011; Latrille et al., 2017; Úbeda et al., 2019) in assuming that: (i) individual fitness is a function of the probability that a DSB is made on the smallest chromosome at a site symmetrically bound by PRDM9, (ii) PRDM9 binding sites compete for a finite number of PRDM9 molecules (i.e., that PRDM9 availability is limiting), and (iii) PRDM9-bound sites compete for a constant number of DSBs. In order to illustrate the importance of these assumptions, we first consider how fitness would change over time with or without these assumptions, under the simplest possible scenario, in which all individuals are homozygous for a single PRDM9 allele and all binding sites have the same binding affinity.
We assume that there are always more PRDM9-bound sites than DSBs per meiosis. If we drop assumptions (ii) and (iii), and instead posit that the number of bound PRDM9 molecules is proportional to the number of binding sites and that the number of DSBs is proportional to the number of bound PRDM9 molecules, fitness will decrease over time as binding sites are lost, as previous models predicted (Figure 2A: green line). This decrease in fitness is due to the dwindling numbers of DSBs per meiosis, and does not reflect changes in the probability of symmetric binding per site, which remains constant over time (Figure 2B: blue lines). If instead we make the more realistic assumption that PRDM9-bound sites compete for a fixed number of DSBs (Diagouraga et al., 2018), but continue to assume that PRDM9 binding is not competitive (i.e., dropping assumption (ii)), fitness does not change over time, because the number of DSBs per meiosis and the probability of symmetric binding per site remain constant (Figure 2A and B: blue lines). Importantly, in this case, there is no selection to drive the evolution of PRDM9. Lastly, we consider that both the availability of PRDM9 and DSBs are limiting, such that binding sites will compete PRDM9 molecules and PRDM9 bound sites will compete for DSBs (Flachs et al., 2012; Baker et al., 2015; Diagouraga et al., 2018). In this case, fitness increases over time (Figure 2A: red line), because, when binding sites are lost to BGC and their number decreases, the proportion of sites that are bound symmetrically increases (Figure 2B: red lines). This simple scenario illustrates in what way the predictions of our model diverge from those of previous ones.
Figure 2
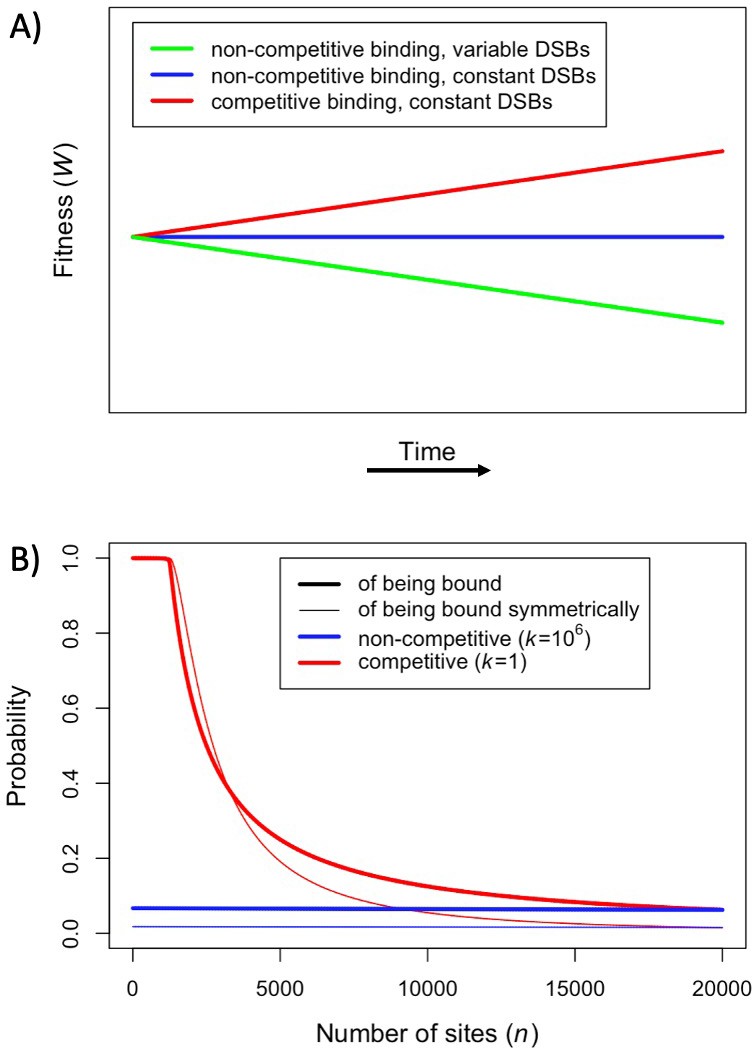
Fitness in the model with one heat.
(A) Cartoon depicting the qualitative change in fitness as a function of time under different models, assuming that all individuals are homozygous for a single PRDM9 allele (without turnover) and that all binding sites have the same binding affinity. For visualization purposes, we present results for a linear function. (B) The probability of an individual binding site being bound (thicker lines) or of a given locus being bound symmetrically (thinner lines) if all sites are very weak and non-competitive (; blue) or very strong and competitive (; red). The values shown were computed using Equation 1, Equation S2.2.2 where, for sake of comparison, in both cases we set the number of PRDM9 molecules such that 5000 sites would be bound in the presence of 20,000 binding sites (roughly consistent with observations in mice Parvanov et al., 2017; Grey et al., 2017). When binding sites are very weak, most PRDM9 molecules are not bound and therefore our model behaves as if there were no competition between binding sites.
Taken at face value, however, this toy analysis suggests that under our model, selection would favor and hence lead to the retention of older PRDM9 alleles, which is inconsistent with clear evidence for the rapid evolution of PRDM9 across taxa (Baker et al., 2017). As we discuss next, this prediction is a consequence of the unreasonable assumption that all binding sites have the same affinity.
Fitness in a model with two heats
To understand how fitness might decay in more realistic settings, with competition among binding sites for PRDM9 molecules and among bound sites for DSBs, we turn to a model with two classes of binding sites. Specifically, we assume that there are a small number of strong binding sites that are bound symmetrically at substantial rates and a larger number of weaker binding sites, which are not. Consequently, recombination occurs almost entirely at the strong binding sites, whose numbers decrease over time and determine how fitness behaves; the weak binding sites, whose numbers do not change substantially over time, provide the backdrop of competitive PRDM9 binding. For the sake of clarity, henceforth we refer to the stronger class of binding sites as ‘hotspots’ and the weaker class as ‘weak binding sites’.
The competitive effect of weak binding sites on individual hotspots is captured by the ratio of the dissociation constant at hotspots to the proportion of PRDM9 bound in the absence of any hotspots (see Appendix 3). We fix the number and dissociation constants of weak binding sites such that 99% of expressed PRDM9 molecules would bind the weak binding sites in the absence of hotspots, while contributing minimally to symmetric binding ( = 200,000, = 8030). We then explore how the dynamics depend on the value of .
First, we consider how fitness depends on the number of hotspots, in individuals that are either homozygous or heterozygous for two PRDM9 alleles with the same binding distribution (Figure 3). (At this point, we do not yet consider the evolutionary dynamics, but gain insights helpful to elucidating these dynamics below.) Increasing the number of hotspots has conflicting effects on fitness: the proportion of bound PRDM9 localized to hotspots rises, and therefore there is a larger number of DSBs at hotspots, but the probability that any given hotspot is bound symmetrically decreases (Figure 3—figure supplement 1). Increasing PRDM9 expression has the opposite effects: it increases the probability that any given hotspot is bound symmetrically, but also increases the proportion of bound PRDM9, and thus DSBs, localized to weak binding sites (Figure 3—figure supplement 1). Consequently, for any value of , there is an optimal number of hotspots that maximizes the probability of forming symmetric DSBs, which increases with PRDM9 expression levels (in order to counteract PRDM9 localization to weak binding sites). These considerations imply that the optimal number of hotspots per allele is smaller in heterozygotes relative to homozygotes (Figure 3). Similarly, the optimal number of hotspots is also smaller when hotspots are stronger, as stronger hotspots both increase the degree of symmetrical binding at hotspots, and result in less binding at weak binding sites (Figure 3).
Figure 3 with 1 supplement see all
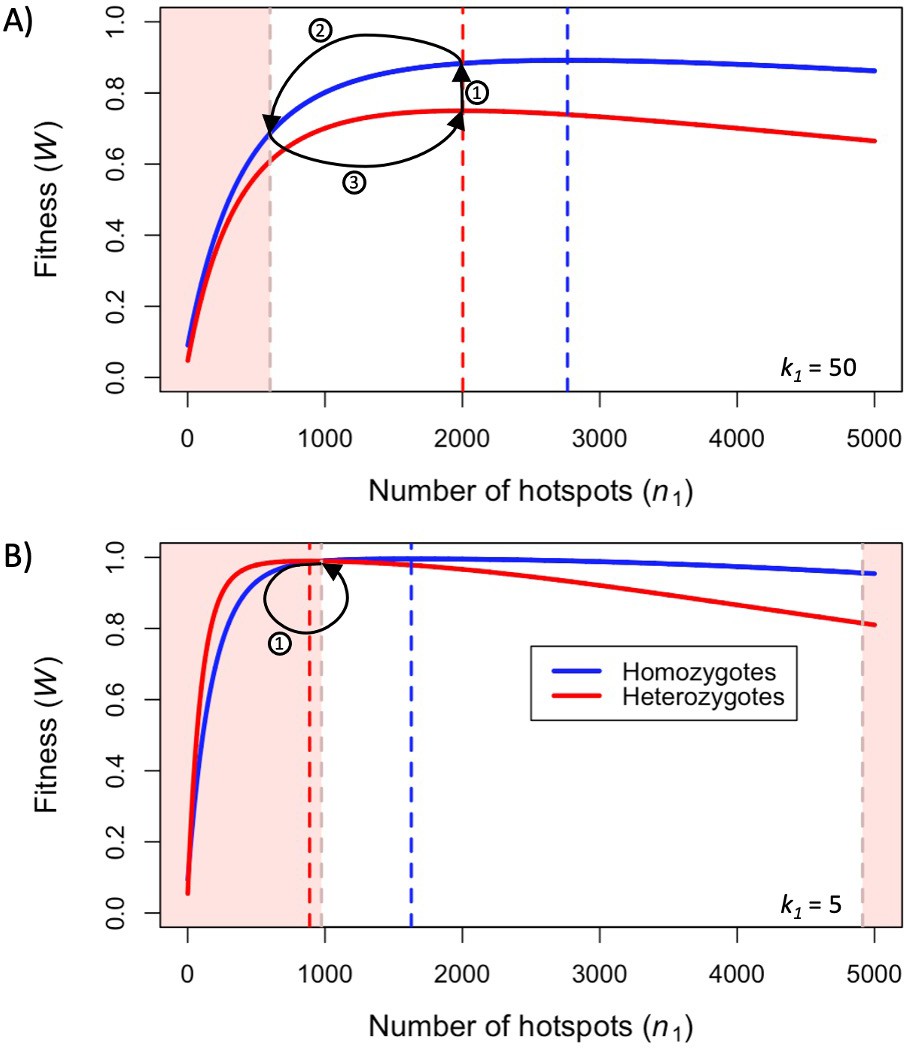
Fitness in the model with two heats.
Fitness as a function of the number of hotspots, for an individual homozygous for a PRDM9 allele (blue), or heterozygous for two PRDM9 alleles with the same number of hotspots (red), when considering (A) weak hotspots or (B) strong ones. Fitness was calculated using Equations 5 and 6, assuming a backdrop of weak binding sites that would bind 99% of PRDM9 molecules in the absence of hotspots. Vertical dashed lines indicate the number of hotspots that maximize the fitness of individuals homozygous (blue) or heterozygous (red) for the allele. The area shaded in light red indicates the number of hotspots where the fitness of an individual homozygous for PRDM9 has lower fitness than the maximal fitness of a heterozygous individual that carries one copy of the same PRDM9 allele (where the other allele has the optimal number of hotspots for heterozygotes). In both panels, the region shaded in light red on the left reflects the case wherein the homozygous individual will have reduced fitness as a consequence of PRDM9 binding to weak binding sites. In panel B, the region on the right reflects the case wherein the homozygous individual will have reduced fitness as a consequence of limited symmetric binding at hotspots. The numbered arrows illustrate the behavior of the simplified evolutionary dynamic described in the text.
When hotspots are relatively weak (e.g. ), fitness will always be higher in individuals homozygous for a given PRDM9 allele than in individuals heterozygous for two distinct PRDM9 alleles with the same number of hotspots (Figure 3A). Weak hotspots are far from being saturated for PRDM9 binding: the increased expression of a given PRDM9 allele in homozygotes relative to heterozygotes results in a notable increase in the probability that hotspots will be bound by PRDM9, while only slightly increasing the proportion of PRDM9 bound to weak binding sites (Figure 3—figure supplement 1A). Consequently, the benefit of the increase in symmetric binding at hotspots outweighs the cost of the slight increase in the proportion of DSBs localized to weak binding sites.
In contrast, when hotspots are relatively strong (e.g., ), fitness can be higher in individuals homozygous for a given PRDM9 allele or heterozygous for two similar alleles, depending on the number of hotspots recognized by the alleles (Figure 3B). When the number of hotspots far exceeds the number of PRDM9 molecules, hotspots are not saturated for PRDM9 binding, and fitness is always higher in homozygotes, as in the case with weaker hotspots. However, when there are fewer hotspots, those hotspots approach saturation for PRDM9 binding and consequently, the increased expression of a given PRDM9 allele in homozygotes relative to heterozygotes has a lesser impact on rates of symmetric binding (Figure 3—figure supplement 1B). Moreover, the cost associated with an increased proportion of PRDM9 localizing to weak binding sites becomes more pronounced (Figure 3—figure supplement 1B). The net effect is that, for PRDM9 alleles that recognize a sufficiently small number of hotspots, fitness is higher in heterozygotes than in homozygotes. Thus, in contrast to the case for weaker hotspots, individuals heterozygous for two PRDM9 alleles, each with the optimal number of hotspots for heterozygotes, will have higher fitness than individuals homozygous for a PRDM9 allele with the same number of hotspots (Figure 3B).
The relationship between the fitness of homozygotes and heterozygotes provides important insights into the evolutionary dynamics of our model. Consider a simplified model, with a population of infinite size, in which mutations to PRDM9 alleles with any number of hotspots arise every generation. If individuals heterozygous for a given mutant allele have greater fitness than any other individual in the population, that allele will quickly invade the population and rise to appreciable frequencies. Under these conditions, the PRDM9 alleles that successfully invade the population will necessarily be those with optimal numbers of hotspots in heterozygotes. When hotspots are sufficiently weak (e.g., ), the population exhibits cycles (Figure 3A): a PRDM9 allele with the optimal number of hotspots in heterozygotes invades the population and eventually fixes (arrow 1 in Figure 3A), after which individuals are homozygous for that allele and have greater fitness than any PRDM9 heterozygote, thereby preventing any other new allele from invading the population. Hotspots will then be lost from the population (arrow 2 in Figure 3A), until another PRDM9 allele can invade (arrow 3 in Figure 3A), fix and begin a new cycle. When hotspots are sufficiently strong (e.g., ), the population remains at a fixed point at which PRDM9 alleles with the optimal number of hotspots in heterozygotes are constantly invading (Figure 3B). Indeed, once an allele reaches appreciable frequency, individuals become homozygous for the allele; their fitness becomes lower than that of a heterozygote for the allele and a new PRDM9 allele with the optimal number of hotspots; and the allele is prevented from reaching fixation. These two kinds of behaviors, of cycles and a fixed point, are also seen under the more realistic evolutionary model that we consider next.
Dynamics of the two-heat model
In particular, we consider the dynamic in a population of finite size, with a finite number of random mutations at the PRDM9 locus every generation. We assume that the number of hotspots associated with new PRDM9 alleles is uniformly distributed across a wide range (), which spans the optimal values for both homozygotes and heterozygotes across the range of hotspot dissociation constants explored (). An alternative assumption would be to have the distribution of the initial number of hotspots tightly concentrated around the number of binding sites that best match the specificity of a typical PRDM9 ZF array; we explore the evolutionary dynamic of such a choice in Appendix 5 and there we note the few places in which the assumption has a qualitative effect on our results.
Where possible, the values that we use for other model parameters are based on empirical observations in mice and humans, including the mutation rates at the PRDM9 locus and its binding sites, the number of DSBs initiated per meiosis, and the probability that a gene conversion event removes the hot allele at a PRDM9 binding site in individuals heterozygous for hot and cold alleles (Table 1). Given some uncertainty regarding estimates of the number of PRDM9 molecules expressed during meiosis, we explore the evolutionary dynamics with alternative values spanning a plausible range in Appendix 4; these changes do not have a qualitative effect on our results. Here, we use simulations (described in the model section) to study how the evolutionary dynamics depend on the dissociation constant at hotspots, k1, which we know less about, and the effective population size, which varies over orders of magnitude in natural populations (Leffler et al., 2012).
When the population size is sufficiently large (e.g., ), the dynamics are similar to that of the infinite population size case considered in the previous section (Figure 4A and C). When hotspots are fairly weak (e.g., ), they follow an approximate cycle (Figure 4A): a new PRDM9 allele that establishes a near optimal number of hotspots for heterozygotes invades and fixes, dominating the population in a homozygous state until enough hotspots are lost that the population becomes susceptible to invasion of a new allele that likewise establishes a near optimal number of hotspots for heterozygotes. Diversity at the PRDM9 locus is low throughout most of this cycle, with bouts of diversity in the period during which the dominant allele is taken over by a new one. Fitness peaks when a new allele is fixed and then decreases over time, as that allele loses its hotspots.
Figure 4
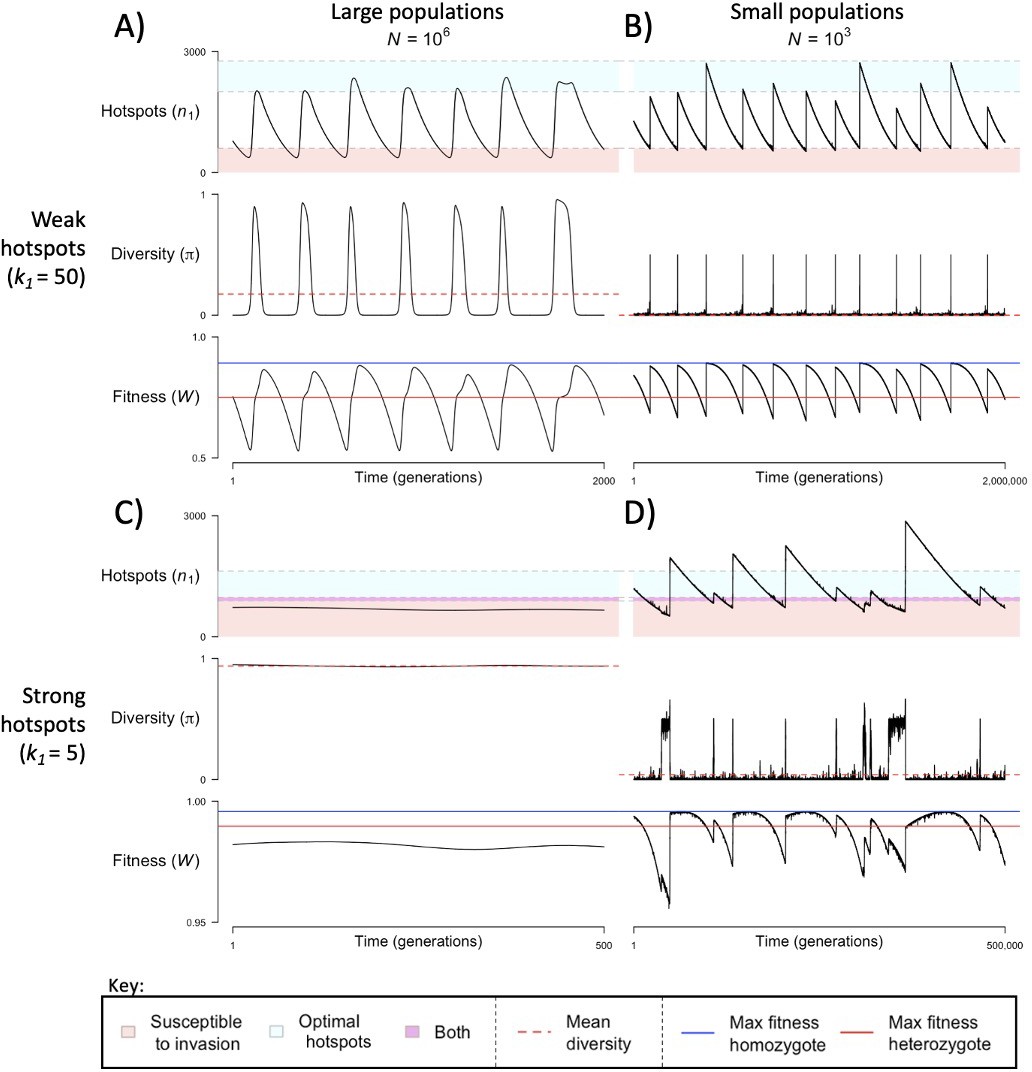
The dynamics of the model with two heats.
The mean number of hotspots (), diversity at PRDM9 (), and mean fitness (), as a function of time. We show four cases: with weak and strong hotspots (top and bottom rows, respectively) and large and small population size (left and right column, respectively). Simulations (as detailed in the model section) were run with the specified population sizes and hotspot dissociation constants, with other parameter values detailed in Table 1. The time (x-axis) in each plot has been scaled by the duration of PRDM9 turnover to allow for ~10 ‘cycles’ (see Figure 3), which span ~103 times more generations in small populations compared to large ones. The highlighted range of hotspot numbers in which a PRDM9 allele is ‘susceptible to invasion’ corresponds to the regions shaded in red in Figure 3. In turn, the highlighted range of hotspot numbers designated as ‘optimal hotspots’ corresponds to the range between the number that optimizes fitness in heterozygotes and the number that optimizes fitness in homozygotes (between the dashed lines shown in Figure 3). See Appendix 4 for analogous results assuming an alternative value for the number of PRDM9 molecules expressed during meiosis (), and Appendix 5 for analogous results assuming a tight unimodal distribution of the number of hotspots associated with newly arising PRDM9 alleles. This figure was generated using Figure 4—source data 1–4.
-
Figure 4—source data 1
The number of hotspots (), average population fitness (), and diversity at the PRDM9 locus (pi) per generation, across 55,000 simulated generations of the two-heat model with a large population size () and weak hotspots ().
This data was used to generate Figure 4 and Figure 6—figure supplement 2.
- https://cdn.elifesciences.org/articles/83769/elife-83769-fig4-data1-v2.zip
-
Figure 4—source data 2
The number of hotspots (), average population fitness (), and diversity at the PRDM9 locus () per generation, across 2,000,000 simulated generations of the two-heat model with a small population size () and weak hotspots ().
This data was used to generate Figure 4 and Figure 6—figure supplement 2.
- https://cdn.elifesciences.org/articles/83769/elife-83769-fig4-data2-v2.zip
-
Figure 4—source data 3
The number of hotspots (), average population fitness (), and diversity at the PRDM9 locus () per generation, across 55,000 simulated generations of the two-heat model with a large population size () and strong hotspots ().
This data was used to generate Figure 4 and Figure 6—figure supplement 2.
- https://cdn.elifesciences.org/articles/83769/elife-83769-fig4-data3-v2.zip
-
Figure 4—source data 4
The number of hotspots (), average population fitness (), and diversity at the PRDM9 locus () per generation, across 500,000 simulated generations of the two-heat model with a small population size () and strong hotspots ().
This data was used to generate Figure 4 and Figure 6—figure supplement 2.
- https://cdn.elifesciences.org/articles/83769/elife-83769-fig4-data4-v2.zip
In contrast, when hotspots are strong (e.g., ), dynamics are approximately at a fixed point (Figure 4C): new PRDM9 alleles that lead to near optimal numbers of hotspots for heterozygotes continually invade but never fix. The fitness of individuals homozygous for such PRDM9 alleles is lower than that of individuals heterozygous for one such allele and those already present. Consequently, new PRDM9 alleles experience frequency-dependent selection, in which they are favored at low frequencies because they have near optimal numbers of hotspots for heterozygotes, but selected against at higher frequencies because of the reduced fitness of homozygotes. Diversity remains high and average fitness is approximately constant.
In smaller populations (e.g., ), the dynamic is qualitatively similar to that in larger populations when hotspots are fairly weak (e.g., ; compare Figure 4A and B). The reduced mutational input at hotspots and correspondingly lower rate at which they are lost leads to longer intervals of time between fixation events. In turn, the reduced mutational input at PRDM9 and stronger drift leads to reduced peaks of PRDM9 diversity during those events.
In contrast, when hotspots are strong (e.g., ), dynamics differ markedly in smaller population compared to larger ones (compare Figure 4C and D): whereas in large populations, PRDM9 alleles never fix, in small populations, the lower mutational input at the PRDM9 locus and stronger genetic drift allow PRDM9 alleles to fix intermittently (Figure 4D). PRDM9 alleles with a small number of hotspots are typically lost rapidly and without reaching fixation, the same behavior as in larger populations. But when a mutation occurs to a PRDM9 allele with a large number of hotspots, such that homozygotes for the new allele have higher fitness than any heterozygotes (see Figure 3B), and the allele happens to reach high frequency by chance, it can be maintained in the population at appreciable frequency. Eventually, however, it loses a sufficient number of hotspots for the population to become susceptible to the invasion of a new PRDM9 allele. These chance fixation events and the corresponding number of hotspots leads to intermittent, chaotic cycles.
Regardless of the population size, stochasticity in the PRDM9 mutations that arise and escape immediate loss gives rise to a distribution of initial number of hotspots associated with segregating PRDM9 alleles. If the mutational distribution of the number of hotspots is tightly centered around a value dictated by the properties of the PRDM9 ZF array, then this distribution dictates the distribution of the initial number of hotspots for segregating alleles (see Appendix 5). If the mutational distribution is wider, as we assume here, then the distribution for segregating alleles is largely shaped by the evolutionary dynamics. We estimate this distribution in simulations by weighting the initial number of hotspots of PRDM9 alleles by the product of the alleles’ sojourn times and mean frequencies; this weighting is equivalent to the probability of randomly sampling segregating alleles from the population (Figure 5). The distribution primarily reflects the number of hotspots of successfully invading alleles, and its mean is therefore near the optimal number of hotspots for heterozygotes (Figures 5 and 6A), although generally greater. Moreover, it is closer to the optimum in large populations than in small ones, because with greater mutational input at PRDM9, the alleles that invade in larger populations tend to be closer to the optimum (Figure 6A). By the same token, when hotspots are strong and the population size is small, the intermittent fixations of PRDM9 alleles with a large number of hotspots shift the distribution towards larger initial numbers of hotspots (Figures 5 and 6A).
Figure 5
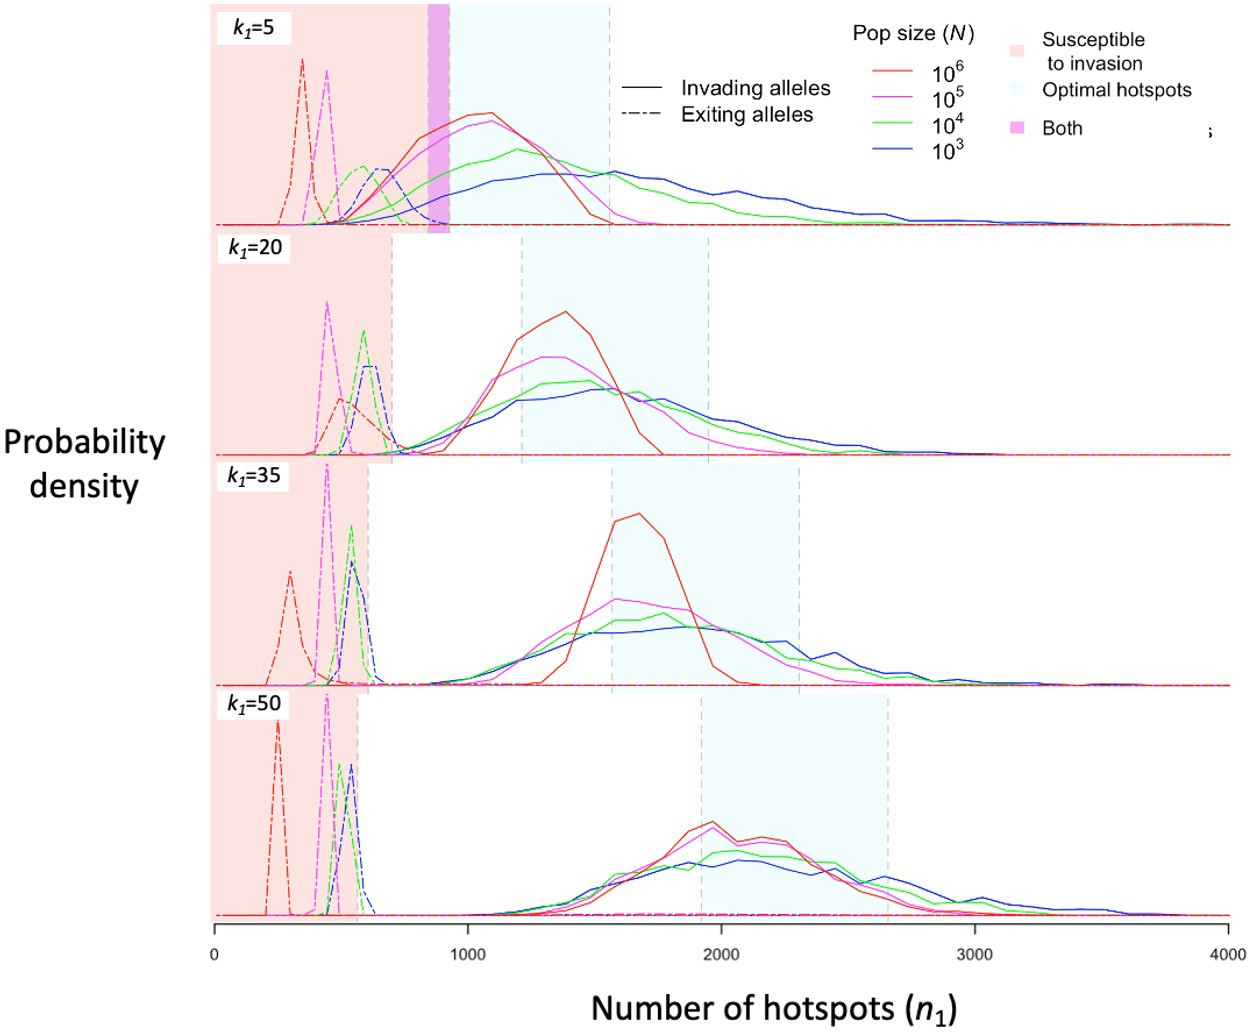
The distribution of initial and final numbers of hotspots among segregating PRDM9 alleles.
The relative densities of initial and final numbers of hotspots (corresponding to invading and exiting alleles, respectively) for different dissociation constants (rows) and population sizes (line colors) obtained from simulations of five million PRDM9 allele trajectories with each set of parameters (see the model section for details about the simulations and Table 1 for other parameter values). Shaded regions are defined the same way as in Figure 4. This figure was generated using Figure 5—source data 1–2.
-
Figure 5—source data 1
The distribution of the initial number of hotspots () among PRDM9 alleles, weighted by their mean allele frequency and sojourn time.
The first two columns represent population size () and the dissociation constant at hotspots () respectively. The remaining 50 columns describe the distribution in bins, with each bin corresponding to a range of 100 initial hotspots (e.g., the first column represents the probability of drawing an allele from the population at random which initially began with between 1 and 100 hotspots). This data was used to generate Figure 5.
- https://cdn.elifesciences.org/articles/83769/elife-83769-fig5-data1-v2.zip
-
Figure 5—source data 2
The distribution of the number of hotspots () among exiting PRDM9 alleles, weighted by their mean allele frequency and sojourn time.
The first two columns represent population size () and the dissociation constant at hotspots () respectively. The remaining 100 columns describe the distribution in bins, with each bin corresponding to a range of 50 initial hotspots (e.g., the first column represents the probability of drawing an allele from the population at random which would ultimately leave the population with between 1 and 50 hotspots). This data was used to generate Figure 5.
- https://cdn.elifesciences.org/articles/83769/elife-83769-fig5-data2-v2.zip
Figure 6 with 2 supplements see all
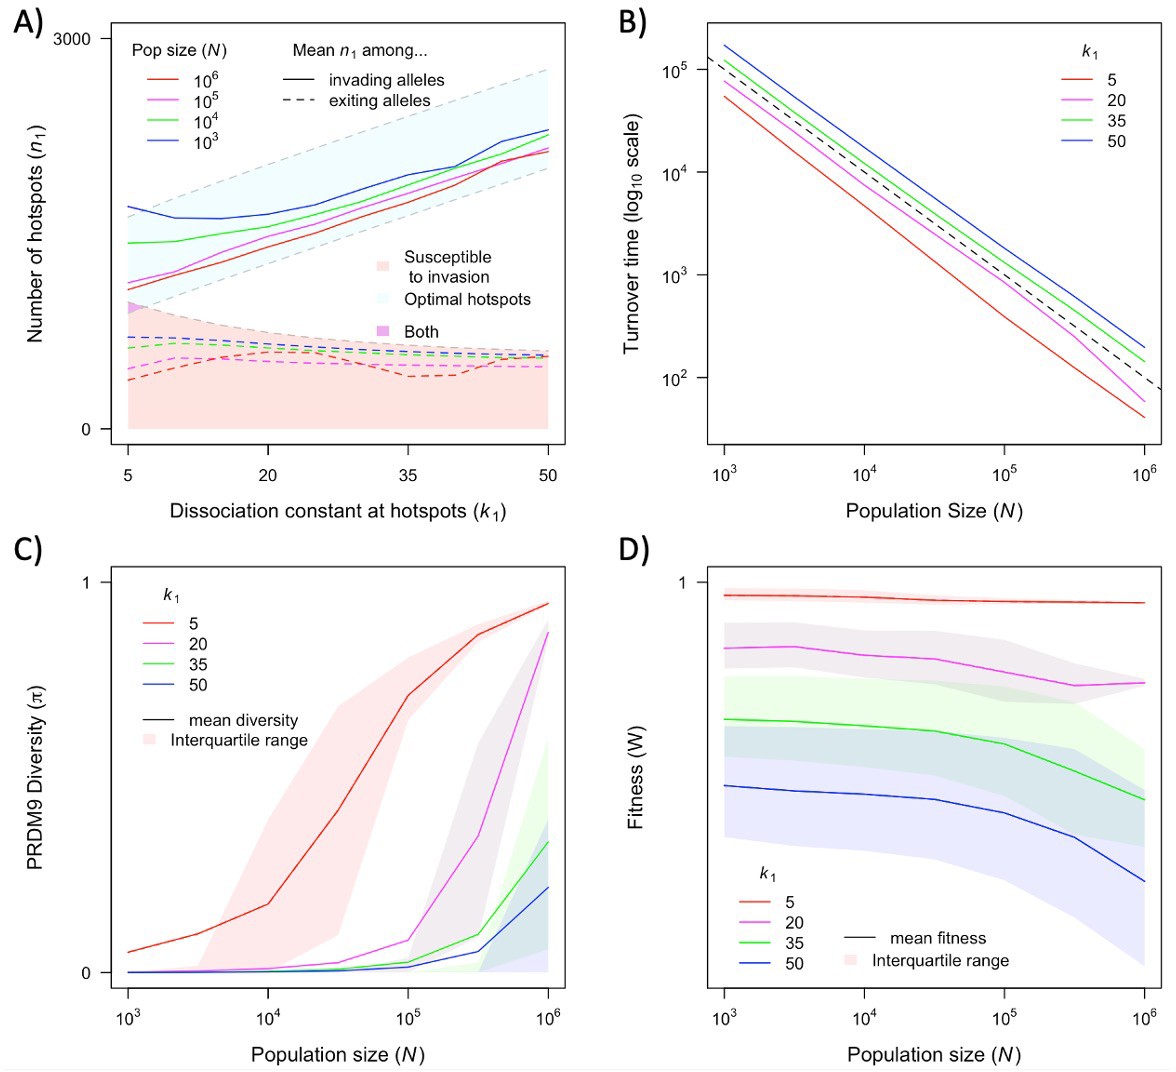
The dependence of key quantities on population size and hotspot heat.
(A) Mean number of hotspots among incoming and exiting alleles (corresponding to the distributions shown in Figure 5). (B) Average turnover time of segregating PRDM9 alleles (see text). (C) Mean and interquartile range of diversity at PRDM9 over time. (D) Mean and interquartile range of fitness in the population. Each point in these graphs is based on simulations of 5x10⁶ PRDM9 alleles (see model section for details) with the specified parameter values and the other model parameter values specified in Table 1. See Appendix 4 for analogous results, assuming alternative levels of PRDM9 expression. This figure was generated using Figure 6—source data 1 and 2.
-
Figure 6—source data 1
Summary statistics from simulations for a range of population sizes () and hotspot dissociation constants (), including mean turnover times, mean initial numbers of hotspots, and mean number of hotspots for exiting PRDM9 alleles (each weighted by the sojourn time of PRDM9 alleles).
This data was used to generate Figure 6.
- https://cdn.elifesciences.org/articles/83769/elife-83769-fig6-data1-v2.zip
-
Figure 6—source data 2
Additional summary statistics from simulations for a range of population sizes () and hotspot dissociation constants (), including mean diversity at PRDM9 () and population fitness (), and the inter-quartile ranges of each.
This data was used to generate Figure 6.
- https://cdn.elifesciences.org/articles/83769/elife-83769-fig6-data2-v2.zip
The distribution of the number of hotspots associated with PRDM9 alleles by the time they exit the population also reflects the invasion dynamics of new PRDM9 alleles. We estimated this distribution in the same way that we did for the initial number (Figures 5 and 6A). Given that exiting PRDM9 alleles continue to lose hotspots during the time it takes for a new invading PRDM9 allele to arise and fix, the mean of the distribution is below the number at which the population becomes susceptible to invasion by heterozygotes carrying a new allele with the optimal numbers of hotspots. More hotspots are lost during this time in larger populations than in smaller ones, owing to the larger mutational input at binding sites and thus the greater rate of loss in larger populations. The turnover time of PRDM9 alleles is largely determined by the rate at which hotspots are lost and the number that are lost before a new allele becomes favored. We estimate the mean turnover time in simulations using the same weighting across alleles as described above. Turnover time is inversely proportional to population size (Figure 6B), because the increase in mutational input at binding sites and thus the rate at which they are lost are proportional to the population size (see Equation 11); other factors, such as the mutational input at PRDM9, have negligible effects by comparison (Figure 6—figure supplement 1A, Figure 6—figure supplement 2). The proportionality constant relating turnover time and population size depends on the heat of hotspots. The turnover time is shorter for strong hotspots than for weak ones (Figure 6B), because PRDM9 alleles with stronger hotspots enter the population with fewer hotspots (Figure 6A) and stronger hotspots experience more DSBs and are therefore lost faster.
The population size and dissociation constant affect diversity levels at the PRDM9 locus in several ways (Figures 4 and 6C). As shown in Figure 4, when hotspots are weak, PRDM9 evolution exhibits cycles, and PRDM9 diversity peaks at the phase in which new PRDM9 alleles invade and ascend to fixation. Average RDM9 diversity in this case can be approximated as the proportion of the cycle that makes up this invasion phase multiplied by the average diversity during this phase. The proportional length of the invasion phase increases when the turnover time is shorter, and the turnover time is shorter in larger populations (Figure 6B). Diversity during the invasion phase also increases with population size, owing to the greater mutational input at the PRDM9 locus (compare, e.g., Figure 4A and B). Consequently, average PRDM9 diversity is expected to be greater in larger populations. Moreover, in smaller populations, average PRDM9 diversity falls outside the interquartile range (Figure 6C), because during most of the cycle, PRDM9 diversity (outside the invasion phase) is very low. When hotspots are strong, there is a population size below which PRDM9 evolution is at steady state with continuously high PRDM9 diversity (with none of the alleles fixing) and above which the dynamics exhibit intermittent fixations and chaotic cycles (compare, e.g., Figure 4C and D). At lower population sizes with intermittent cycles, average PRDM9 diversity increases with population size and falls outside the interquartile range for the same reasons it does with weaker hotspots (Figure 6C). At higher population sizes with continuously high PRDM9 diversity, diversity levels increase with population size owing to the greater mutational input at the PRDM9 locus.
The cycling dynamics characteristic of PRDM9 evolution over much of the parameter space entails a substantial genetic load, i.e., an average fitness that is substantially lower than its optimal value (Figure 6D). This is a straightforward consequence of the number of hotspots associated with the predominant PRMD9 allele being substantially lower than the optimal number during most of the cycle (Figures 5 and 6A). Moreover, in contrast to the usual case, in this setting, average fitness is greater in smaller populations than in larger ones, as the number of hotspots – and thus the fitness associated with the predominant PRDM9 alleles when they fix and when they exit the population – is lower in larger populations than in smaller ones (Figures 5 and 6A).
Discussion
Previous models of PRDM9 evolution demonstrated how selection to maintain a given rate of recombination (e.g., for there to be at least one crossover per chromosome) can act as a countervailing force to the loss of hotspots through gene conversion, and ensure the persistence of hotspots (Ubeda and Wilkins, 2011; Latrille et al., 2017). These models were based on an assumption now believed to be incorrect, however: that the loss of PRDM9 binding sites leads to a reduction in the number of DSBs. Since DSB formation is regulated independently of PRDM9 (Kauppi et al., 2013; Yamada et al., 2017; Brick et al., 2012; Mihola et al., 2019) and hotspots are thought to compete for binding (Diagouraga et al., 2018), it more plausible that when hotspots are lost, PRDM9 simply binds elsewhere. Moreover, since development of these models, new lines of evidence indicate that the successful completion of meiosis requires the formation of DSBs at sites symmetrically bound by PRDM9 across homologous chromosomes, likely in order to assure accurate and efficient homolog pairing (Smagulova et al., 2016; Davies et al., 2016; Gregorova et al., 2018; Hinch et al., 2019; Li et al., 2019; Huang et al., 2020; Mahgoub et al., 2020; Wells et al., 2020; Gergelits et al., 2021; Davies et al., 2021).
Motivated by these discoveries, we developed a new model for the evolution of PRDM9 that accounts for the competition of binding sites for PRDM9 molecules and of PRDM9-bound sites for DSBs, in which the selection pressure stems from the requirement for having at least one DSB at a symmetrically bound site on the smallest chromosome. In our model, the selection driving the evolution of the PRDM9 ZF arises from the requirement of symmetric binding in DSB repair, and thus from changes in the shape of its binding distribution over time, rather than from changes in net binding, as previously assumed. In this setting, the loss of individual binding sites leads to increased PRDM9 binding and DSB formation at remaining sites. The rates at which binding sites are lost from the population due to gene conversion and the probabilities that they experience symmetric DSBs are each determined by their underlying affinities for PRDM9. Strong hotspots are lost more rapidly than weak ones, resulting in a shift from a small number of strong binding sites to a larger number of weak binding sites over the lifespan of a PRDM9 allele. This shift entails a reduction in the number of symmetric DSBs, and eventually selection in favor of a new PRDM9 allele. New PRDM9 alleles restore binding sites, thereby serving as a countervailing force to gene conversion. They are favored because, in doing so, PRDM9 binding is redirected to a smaller proportion of the genome, and is therefore more likely to bind symmetrically.
Scope of the model
Our two-heat model allowed us to characterize a variety of qualitative behaviors and their dependence on evolutionary parameters, many of which are likely to hold for more complex and realistic distributions of heats. Yet the properties of this distribution will affect the quantitative predictions of the model, such as those about the relative fitness in homozygotes and heterozygotes for different PRDM9 alleles, which in turn shape the evolutionary dynamics. At present, we do not know enough about the distribution of heats (notably for newly arising PRDM9 alleles) in order to move toward reliable quantitative predictions. Existing inferences about this distribution do not estimate how much PRDM9 is bound at binding sites that fall below an arbitrary heat threshold (i.e., at sites which are not efficiently bound, but whose heat could increase after a sufficient number of stronger sites are lost) (Baker et al., 2014; Grey et al., 2017; Altemose et al., 2017). Moreover, given our current knowledge, the range of possibilities is too large for an exhaustive theoretical exploration to be feasible. What is needed are estimates of the distribution of heats for given PRDM9 alleles across different genetic backgrounds with varying degrees of erosion.
Also relevant is the number of PRDM9 molecules present in the relevant stage of meiosis and the fraction that are bound. In the two-heat model, we made the simplifying assumption that the vast majority of PRDM9 molecules are bound even in the absence of hotspots. This assumption may be too extreme. In B6 mice heterozygous for B6 and CST derived PRDM9 alleles, in which both alleles have similar mRNA expression levels, the vast majority of both PRDM9-dependent H3K4me3 marks and DSBs (~75%) localize to sites bound by the CST allele (Flachs et al., 2012; Smagulova et al., 2016; Diagouraga et al., 2018). This observation suggests that only one-third of available B6-derived PRDM9 molecules are actually bound. Nonetheless, PRDM9 binding is increased in B6 homozygotes relative to hemizygotes, indicating that PRDM9 binding is limiting in this case (Baker et al., 2015). In this regard, we note that recent pre-print by Genestier et al., 2023 explores a model that is similar to ours but assumes the opposite extreme, namely that PRDM9 binding is non-limiting, and their qualitative results are similar to ours. However, while the degree of competitive binding does not appear to affect the qualitative results, it is will affect quantitative predictions. We therefore focus on the qualitative insights about PRDM9 evolution and the interpretation of empirical observations gleaned from our simple model.
The erosion of the strongest hotspots drives PRDM9 evolution
Gene conversion acts like selection against PRDM9 binding sites, leading to their loss over time (Myers et al., 2010). In our two-heat model, we assume the selection on hotspots is stronger than considered in a previous model ( to 0.021, corresponding to the range of dissociation constants considered, compared to ; Latrille et al., 2017), although far weaker than inferred from the under-transmission of exceptionally hot alleles within humans ( to 0.53; Jeffreys and Neumann, 2002; Berg et al., 2011). A recent estimate of the strength of drive across PRDM9 binding sites suggested that selection may in fact be substantially weaker even than previous models assumed ( to ) and comparable in strength to genetic drift (Spence and Song, 2019). If so, drive would be too weak to explain the turnover of PRDM9 in terms of previous models. In light of these results, Spence and Song, 2019 suggested that only a small subset of strong PRDM9 binding sites, subject to much stronger drive than most, is crucial for the proper segregation of chromosomes during meiosis and it is their erosion that drives PRDM9 evolution. The findings of our two-heat model are consistent with their conjecture: both the rate of DSB formation and the probability of being bound symmetrically by PRDM9 are determined by the underlying binding affinity of a given site. Accordingly, the sites most likely to be symmetrically bound will also experience the highest rates of drive, in accordance with empirical observations (Hinch et al., 2019). We therefore suggest that the hotspots in the two-heat model can be thought of as approximating the behavior of the strongest PRDM9 binding sites within a more realistic, continuous distribution of binding affinities.
Does the erosion of hotspots lead to more or fewer hotspots?
In our two-heat model, when hotspots are lost, PRDM9 binding shifts towards the more plentiful class of weak binding sites. Given a more realistic distribution of heats, we would similarly expect the loss of hotspots to result in PRDM9 binding becoming more dispersed across the genome. Consider, for example, a crude approximation in which PRDM9 binding is strongest at loci with the optimal binding motif, with non-degenerate bases, binding is weaker by comparison at times as many motifs with one mismatch, and so forth. After the optimal binding motifs have eroded, most PRDM9 binding will plausibly shifts toward the next best and larger class of motifs, with one mismatch, and then those with two mismatches, and so on. This consideration suggests that the number of hotspots will increase over time (although the extent to which binding becomes more dispersed will depend on the degree to which PRDM9 binding is limiting). This picture is in stark contrast with the previous understanding of the evolution of hotspots, namely, that gene conversion leads to a reduction in the number of hotspots over time. It further suggests that the heat of observed hotspots should decrease over time. Taken to the extreme, in the absence of PRDM9 turnover, the number of hotspots would continue to increase until the point at which they are no longer hot enough to be considered hotspots.
The evolution of hotspots can also be viewed from other perspectives. The standard, operational definition of hotspots is as short intervals of the genome (typically <2 kilobases) with recombination rates that exceed the local or genome-wide background rate by more than some arbitrary multiplicative factor (e.g., fivefold; reviewed in Tock and Henderson, 2018). By such a definition, whether or not the number of hotspots is actually increasing or decreasing over time as a consequence of gene conversion will depend on the threshold used to define them. Another measure of the number of hotspots, which is arguably more relevant biologically and less arbitrary, could be based on the average number of symmetrically bound sites. From this perspective, we expect the number of hotspots to decrease so long as the probability of being symmetrically bound increases with the probability of experiencing gene conversion.
Previous models suggested that hotspot evolution can be described as a Red Queen theory dynamic, referencing the Red Queen’s (in Lewis Carroll’s Through the Looking-Glass) statement that “it takes all the running you can do, to keep in the same place.” In these models, the number of hotspots associated with a given PRDM9 allele is constantly decreases, and PRDM9 evolves rapidly (‘runs’) to keep the number of hotspots roughly constant. In our model, the queen is still running to stay in the same place, but the direction in which she is running is a matter of perspective. We liken this to the optical illusion of the Penrose stairs. Walking around the stairs in one direction, there is a gradual decrease in the number of symmetrically-bound sites over time, that is suddenly increased upon the appearance of a new PRDM9 allele. Walking in the other direction, there is a gradual increase in the number of loci that are used for recombination, that is suddenly decreased upon the appearance of a new PRDM9 allele. Either way you go around, however, you end up in the same place.
Diversity of the PRDM9 ZF-array
In all species with a complete PRDM9 investigated to date, PRDM9 diversity appears to be high relative to other ZF genes, regardless of the effective population size (Buard et al., 2014; Vara et al., 2019; Alleva et al., 2021). The rate of mutation at the PRDM9 ZF array has been inferred to be quite high, with a ZF copy number change of ~0.3–20 x 10–5 per generation (Jeffreys et al., 2013), as expected from its minisatellite nature. The high mutation rate, however, may be counterbalanced by strong selection favoring specific PRDM9 ZF alleles, as it is for other ZF genes (Ubeda and Wilkins, 2011; Latrille et al., 2017; this study).
In our two-heat model, PRDM9 diversity depends primarily on the population size and the heat of the hotspots considered. With weak hotspots, we observe a cycle in which one PRDM9 allele dominates the population at a time. Diversity is therefore relatively low throughout most of the cycle, but peaks when the dominant allele becomes susceptible to invasion and is eventually lost, as new alleles compete for fixation. With strong hotspots and large population sizes, new PRDM9 alleles constantly invade before any can fix, resulting in a consistently high level of diversity. With strong hotspots and small population sizes, there are intermittent, chaotic cycles driven by an occasional fixation, with periods of high diversity—resembling those in larger populations—in between.
It is unclear which of these dynamics is closer to the one in nature, namely given the true distributions of binding affinities. The strong signatures of erosion at binding sites associated with PRDM9 alleles in several species (Myers et al., 2010; Smagulova et al., 2016; Hoge et al., 2023) seem indicative of a cycling dynamic. In turn, anecdotal evidence suggests that being heterozygote for a minor PRDM9 ZFs is protective against azoospermia in humans (Irie et al., 2009), and the high levels of PRDM9 diversity seen across species with very different effective population sizes might suggest that the dynamics are closer to expectations for strong hotspots. A better understanding of PRDM9 dynamics, and diversity in particular, would be aided by more systematic surveys of diversity levels across species, alongside signatures of lineage-specific erosion and tests for different modes of selection at the PRDM9 locus.
In these regards, it would also be useful to keep in mind a couple of additional factors. First, we assume a panmictic population, whereas population structure is expected to increase diversity. Second, we assume that each new PRDM9 allele recognizes an entirely new set of binding sites, whereas PRDM9 alleles often share a substantial degree of overlap of binding sites (such as for the PRDM9A and PRDM9B alleles in humans) (Pratto et al., 2014; Altemose et al., 2017). Consequently, the number of effectively distinct alleles may be smaller than the number defined based of their observed ZFs.
PRDM9-mediated hybrid sterility
Most empirical manipulations that rescue fertility in otherwise sterile crosses of hybrid mice can be readily understood as restoring symmetric binding (Davies et al., 2016; Gregorova et al., 2018; Davies et al., 2021). Two of these manipulations require more nuanced explanations, however: notably, why is it that fertility can be restored by either (i) increasing the expression of either PRDM9 allele present (Flachs et al., 2012), or by (ii) removing one allele but not the other, for example removing the B6 allele in a cross between B6 and PWD mice (Flachs et al., 2012). Considering these findings in light of our model suggests a plausible explanation.
In the sterile hybrids, no sites experience a symmetric DSB on the smallest chromosome. Nonetheless, binding sites for both alleles occur on their respective parental backgrounds, as evidenced by their use in the parental mice. Why then are they not used in the hybrids? We suggest that the reason is because PRDM9 is limiting, and the available PRDM9 is being sequestered to the non-parental genetic background, where their strongest binding sites have not been eroded. Increasing PRDM9 expression of either allele results in more PRDM9 binding at parental binding sites, allowing for symmetric binding. In turn, the effect of removing a PRDM9 allele should depend on which allele exhibits more symmetric binding in the hybrid. When one allele is removed, a greater number of DSBs localize to sites bound by the remaining allele. Consequently, removing the allele that exhibits more symmetric binding should further decrease the probability of a symmetric DSB, whereas removing the other allele should increase it.
Why use hotspots?
Given recent findings, the evolutionary benefit of PRDM9 binding symmetrically plausibly stems from the preferentially use of the same loci on one chromosome for DSB initiation and, on the homologous chromosome, for DSB repair (see Introduction). This strategy improves the efficacy of both homolog pairing and DSB repair, potentially by reducing the search space during homolog engagement and/or by increasing the accessibility of the loci for strand invasion and subsequent steps of repair. It may further improve the accuracy of the repair process by reducing the odds of ectopic exchange. Davies et al., 2016 hypothesized that by the same reasoning, the advantage of hotspots may be to limit recombination to a small proportion of the genome (in species that do not use PRDM9 but have hotspots, such as birds, as well as those that do; Singhal et al., 2015). In this regard, it is noteworthy that taxa with DSB-independent mechanisms of homolog pairing, such as Drosophila or C. elegans, do not have hotspots (Manzano-Winkler et al., 2013; Smukowski Heil et al., 2015; Kaur and Rockman, 2014; Bernstein and Rockman, 2016), whereas most species with DSB-dependent mechanisms, such as most yeast, plants or vertebrates, do (Auton et al., 2013; Singhal et al., 2015; Lam and Keeney, 2015; Yelina et al., 2015; Tock and Henderson, 2018; Liu et al., 2019).
In our model, as well as in a more recent model from Genestier et al., 2023, the benefit of symmetric PRDM9 binding is assumed from the outset, by postulating that fitness is a function of the probability of a symmetric DSB. In both models, the erosion of the strongest hotspots during the lifespan of a PRDM9 allele leads to a smaller proportion of symmetrically bound hotspots, and given the fixed and limiting number of DSB in both models, results in fewer symmetric DSB and lower fitness. Our assumption that PRDM9 binding is limiting leads to a further benefit of maintaining a small number of strong hotspots, because when there are too many, the competition among strong hotspots for PRDM9 makes symmetric binding even less likely. One could envision future extensions of our model in which the benefits of symmetric DSB arise mechanistically rather than being postulated, by modeling of the processes of homolog pairing and/or DSB repair (e.g. in which the benefit of symmetry is reduced in the presence of excess PRDM9 binding, because PRDM9 binding becomes less indicative of homology). Nonetheless, even without such extensions, our results clarify how the requirement for symmetry shapes the recombination landscape by favoring the use of a small proportion of the genome for recombination.
Why use PRDM9?
PRDM9 arose prior to the common ancestor of animals and has since been repeatedly lost, including more than a dozen times across vertebrates (Baker et al., 2017; Cavassim et al., 2022). In vertebrate lineages in which PRDM9 has been lost, such as canids, birds or percomorph fish, as well as in PRDM9 knockout mice and rats, and to a minor degree in sterile mice hybrids, recombination events are concentrated in hotspots that tend to be found associated with promoter-like features of the genome, such as transcriptional start sites and/or CpG-islands (Brick et al., 2012; Auton et al., 2013; Singhal et al., 2015; Smagulova et al., 2016; Mihola et al., 2021). The same is true for lineages that are not believed to have ever carried PRDM9 but have recombination hotspots, such as in plants or fungi (Yelina et al., 2015; Lam and Keeney, 2015). Therefore, this mechanism for localizing hotspots is likely ancestral to the evolution of PRDM9’s role in recombination, and is retained in the presence of PRDM9. Indeed, recent work suggests that the two mechanisms may be engaged in a tug of war, the outcome of which is more lopsided in mice and humans and more even in other species, such as snakes (Hoge et al., 2023).
Given the existence and retention of an alternative mechanism, the benefit of PRDM9 is unclear. If species without PRDM9 also recruit factors involved in both DSB initiation and DSB repair on both homologs, then PRDM9 may be favored when it further enhances the degree of symmetric recruitment of such factors relative to that of default hotspots, that is when PRDM9-mediated hotspots are fewer and hotter than default hotspots given the same number of DSBs. In support of this possibility, DSB heats measured by DMC1 ChIP-seq are higher in wild type than in PRDM9-/- mice (Brick et al., 2012).
If PRDM9 improves the efficiency of DSB-dependent homolog engagement, it may also enable the successful completion of meiosis with fewer DSBs—a potentially important secondary benefit, given that DSBs pose an inherent danger to cellular survival (Cooper et al., 2016). While the number of DSBs formed per meiosis is regulated independently of PRDM9, we speculate that, given a requirement for a certain number of ‘symmetric DSBs’ per meiosis, the number of DSBs made in a typical germ cell might co-evolve with the degree of symmetric PRDM9 binding. Notably, not all strains of mice are sterile when PRDM9 is knocked out, and those which are tend to have fewer DSBs per meiosis (Mihola et al., 2019), which seems to support the hypothesis that PRDM9 may be especially important for the successful completion of meiosis with fewer DSBs.
Another evolutionary puzzle remains open: why PRDM9 has been lost so many times in different lineages (Baker et al., 2017; Cavassim et al., 2022). Perhaps the answer to this question also relates to the advantage of symmetry. In species in which segregating PRDM9 alleles no longer provide an advantage over the default use of promoter-like features, there may no longer be selection to maintain PRDM9, allowing it to be lost by genetic drift. Alternatively, the reduced symmetry at default sites relative to PRDM9 binding sites might be compensated for by larger numbers of DSBs (possibly present, despite their inherently dangerous nature, for other evolutionary reasons), or because other changes increase the efficiency of DSB repair, rendering symmetry less important.
Appendix 1
Molecular dynamics of PRDM9 binding
We first consider the case in which all binding sites for a given PRDM9 allele have the same binding affinity. At equilibrium, the rate at which PRDM9 molecules dissociate from their binding sites equals that rate at which they bind them. Denoting the expected number of bound PRDM9 molecules by and the rate of dissociation of a bound PRDM9 molecule by , the total rate of PRDM9 dissociation is (see Table 1 for a summary of notation). Further denoting the expected number of free PRDM9 molecules by , the expected number of free binding sites by and the rate of association between a free PRDM9 molecule and a given binding site by , the total rate at which PRDM9 molecules bind is . Therefore, at equilibrium
or equivalently
(S1.1)
where is the dissociation constant. Substituting (where is the total number of binding sites per chromatid) into Equation S1.1 and solving for the expected number of bound PRDM9 molecules, we find that
(S1.2)
In this way, we see that the probability that a given site is bound by PRDM9, its “heat”, is
(S1.3)
Next, we solve for the expected number of free PRDM9 molecules, . Substituting (where is the total number of PRDM9 molecules) into Equation S1.2 and rearranging it, we end up with a quadratic in :
The general solution for this quadratic is
but further noting that and that the expected number of free PRDM9 molecules must be positive, we find that
(S1.4)
The case in which a PRDM9 molecule has binding sites with different affinities can be treated analogously. In this case, the equilibrium requirement must be met for sites of each affinity. By analogy to Equation S1.2, we find that
(S1.5)
where is the expected number of PRDM9 molecules bound to sites with the i-th affinity, is the total number of these sites and is their dissociation constant. Similarly, by analogy to Equation S1.3, we find that the probability that a binding site with the i-th affinity is bound by PRDM9, its “heat”, is
(S1.6)
In order to solve for the expected number of free PRDM9 molecules, we note that
where is the number of different binding affinities. Substituting the expression for from Equation S1.5 into this one, we find that
(S1.7)
which is a polynomial of degree in that can be solved numerically.
In the case with two binding affinities, rearranging Equation S1.7 yields the cubic equation:
with coefficients , and . The solution of this equation is given by
where and .
Appendix 2
The probability of a symmetric DSB
We define a “symmetric DSB” at a given binding site as the event in which, considering the four chromatids, at least one of four copies of the binding site (across the four copies of the chromosome present) during meiosis has been bound by PRDM9 and experienced a DSB and at least one of the two copies on the homologous chromosomes has also been bound by PRDM9.
We first consider the probability that at least one of the two copies on a pair of sister chromatids has been bound by PRDM9 and experienced a DSB. The probability that a given copy with binding affinity has been bound is ; having been bound, the probability that it experiences a DSB is , and therefore the probability of both is . The probability that at least one of the two copies on sister chromatids experienced both is the complement of the probability that neither of them did, that is
Similarly, the probability that at least one of the copies on the homologous chromosomes has been bound by PRDM9 is
Assuming independence, the probability that the binding site on a given homologous chromosome has been bound and experienced a DSB and that the corresponding site on the other homologous chromosome has been bound is the product of the above expressions
Lastly, given that either chromosome could be the one to experience the DSB, the probability of a ‘symmetric DSB’ is the complement of the probability that a ‘symmetric DSB’ occurs in neither direction, that is
(S2.1)
By the same token, the probability that a site with binding affinity has been symmetrically bound, regardless of DSBs (as shown in Figure 2B), is the complement of the probability that that neither chromatid on either homolog has been bound, i.e.,
(S2.2)
Appendix 3
The competitive effect of weak binding sites in the two-heat model
The molecular and evolutionary dynamics of a PRDM9 allele in the two-heat model depends on three parameters that describe allele properties and on two variables. The parameters are the number of PRDM9 molecules, , the dissociation constant of hotspots, , and the dissociation constant of weak binding sites, ; the variables are the total numbers of hotspots, , and of weak binding sites, . Here we show that in the parameter regime of interest to us, we can describe the dynamics in terms of a single variable ( and two parameters: and , where is the expected number of free PRDM9 molecules in the absence of hotspots. The latter, compound parameter reflects the competitive effect of the backdrop of weak binding sites on binding hotspots. This reduction in the number of parameters greatly simplifies our analysis in the main text.
We assume that there are a small number of strong binding sites, which are bound symmetrically at appreciable rates—termed “hotspots” in the main text—and a larger number of weaker binding sites, which compete with hotspots for PRDM9 binding, but are rarely bound symmetrically. Specifically, we require that weak binding sites are much weaker and more numerous than hotspots, i.e., and respectively, and that the number of weak binding sites far exceeds the number of PRDM9 molecules, i.e., , such that any given weak binding site is rarely bound, i.e., . Alongside Equation S1.6, the latter condition implies that
(S3.1)
and thus that
(S3.2)
These conditions also imply that the change to the number of weak binding sites is negligible, implying that we can treat as approximately constant, leaving us with a single variable: the number of hotspots, . We also require that most PRDM9 molecules are bound at equilibrium, i.e., that . In its extreme, this implies that the expected number of free PRDM9 molecules in the absence of hotspots .
In order to demonstrate that under these conditions, we can approximate the dynamics in terms of two parameters ( and ), we show that the equations that govern the evolution of a PRDM9 allele and its binding sites are well approximated using these parameters alone. First, with negligible probability of a symmetric DSB at a weak binding site (), the fitness of a homozygote for a PRDM9 allele is well approximated by
(S3.3)
which depends only on and on the probability of a symmetric DSB at hotspots, . The same can be easily shown for the fitness of a heterozygotes for PRDM9: namely, that it depends only on and of the two PRDM9 alleles. In turn, both the probability of a symmetric DSB at a hotspot (Equation 4):
and the rate of gene conversion experienced by hotspots (Equation 9):
depend on the probability of hotspots being bound, , and on the probability of bound sites experiencing a DSB, . Given that , the probability of bound sites experiencing a DSB is well approximated by
with being the total number of PRDM9 molecules in homozygotes (the result for heterozygotes for PRDM9 is the same, given our assumption that the sum of the number of PRDM9 molecules of both kinds equals ; see Equation 3). Thus, what remains for us to show is that depends only on , and .
To this end, we derive an equation for and show that it can be expressed in terms of these parameters alone. First, we express the total number of PRDM9 molecules as the sum of those that are free, bound to hotspots, or bound to weak binding sites:
Substituting (Equation S3.1) and (from Equation S1.6) and rearranging this equation, we find that
(S3.4)
Next, we solve for the number of free PRDM9 in the absence of hotspots. Once again, we express the total number of PRDM9 molecules as a sum of free and bound ones, and substitute (Equation S3.1), where in this case, we find that
and thus that
(S3.5)
Substituting this expression into Equation S3.4, we attain a quadratic for ,
(S3.6)
with coefficients that are expressed in terms of , and .
Appendix 4
The effect of PRDM9 expression level
As we noted, there is considerable uncertainty about the number of PRDM9 molecules expressed during meiosis (see section on Estimated parameters). In the result section of the main text, we assumed this number to be 5000, based on empirical estimates of the number of PRDM9-bound sites per meiosis in mice, on the assumption that that almost all expressed PRDM9 molecules are bound. In particular, our choice is roughly consistent with cytological observations of thousands of PRDM9 foci in meiotic nuclei in mice (Parvanov et al., 2017; Grey et al., 2017). It is also consistent with estimates of 4700±400 PRDM9-modified sites in B6 mice meiotic nuclei (Baker et al., 2014). To arrive at these estimates, Baker et al. divided H3K4me3 ChIP-seq reads at PRDM9-dependent peaks by MNase-digested input DNA. This approach plausibly overestimates the number of PRDM9-bound sites, however, because binding sites that were not bound by PRDM9 and should have been included in the denominator might have been digested by the MNase. Here, we therefore examine how our main results are affected by assuming smaller numbers of expressed PRDM9 molecules. Specifically, we set the number of PRDM9 molecules () to 500, 1000, or 2500.
Within this range, the qualitative dynamics of the two-heat model are insensitive to the level of PRDM9 expression level (compare Appendix 4—figure 1 to Figure 4). In particular, the qualitative behaviors observed when varying the strength of hotspots and population size remain the same.
Appendix 4—figure 1
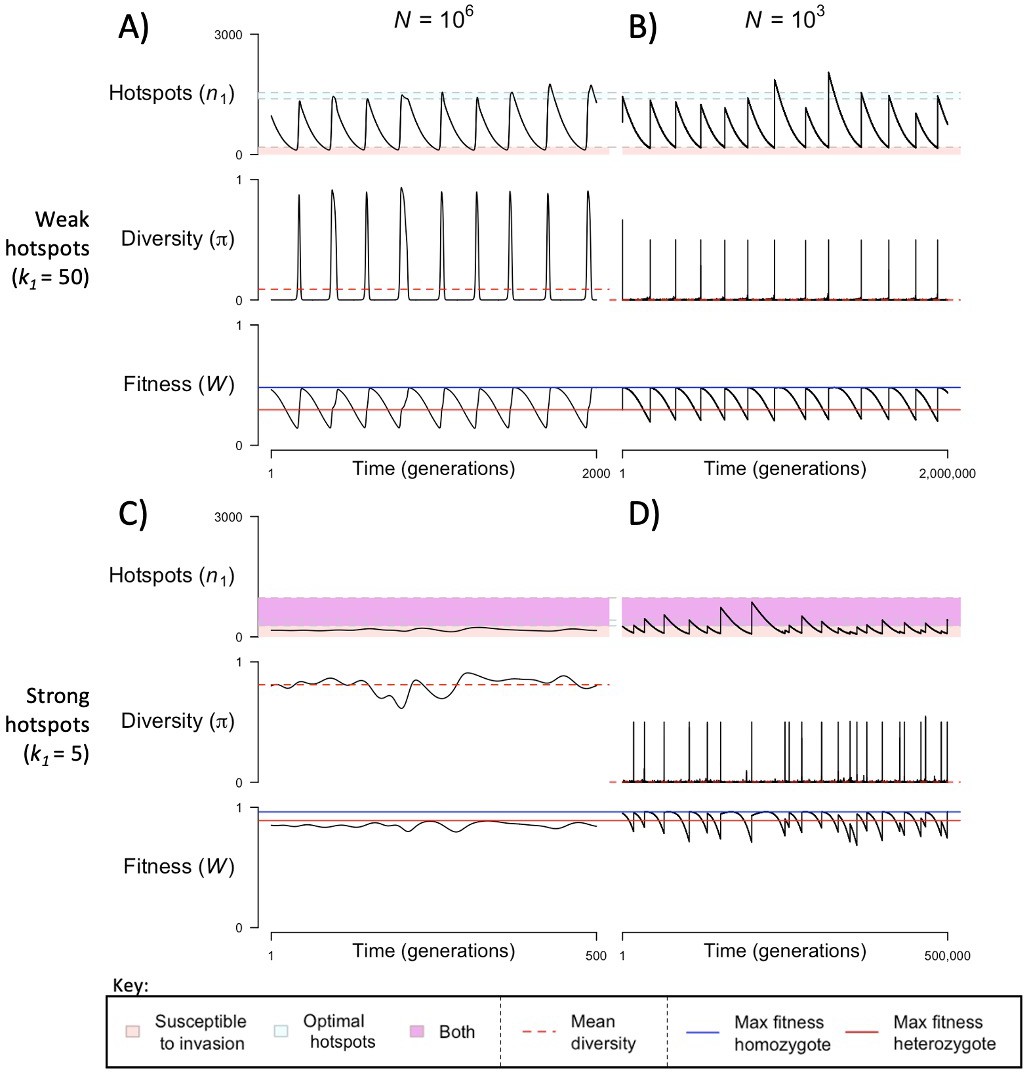
Dynamics of the two-heat model when .
The mean number of hotspots (), diversity at PRDM9 (), and mean fitness (), as a function of time. We show four cases: with weak and strong hotspots (top and bottom rows respectively) and large and small population size (left and right column respectively). See Figure 4 and Appendix 4 for details. This figure was generated using Appendix 4—figure 1—source data 1–4.
-
Appendix 4—figure 1—source data 1
The number of hotspots (), average population fitness (), and diversity at the PRDM9 locus (pi) per generation, across 2,000 simulated generations of the two-heat model with a large population size () and weak hotspots (), and a smaller number of expressed PRDM9 molecules ().
This data was used to generate Appendix 4—figure 1.
- https://cdn.elifesciences.org/articles/83769/elife-83769-app4-fig1-data1-v2.zip
-
Appendix 4—figure 1—source data 2
The number of hotspots (), average population fitness (), and diversity at the PRDM9 locus () per generation, across 2,000,000 simulated generations of the two-heat model with a small population size () and weak hotspots (), and a smaller number of expressed PRDM9 molecules ().
This data was used to generate Appendix 4—figure 1.
- https://cdn.elifesciences.org/articles/83769/elife-83769-app4-fig1-data2-v2.zip
-
Appendix 4—figure 1—source data 3
The number of hotspots (), average population fitness (), and diversity at the PRDM9 locus () per generation, across 500 simulated generations of the two-heat model with a large population size () and strong hotspots (), and a smaller number of expressed PRDM9 molecules ().
This data was used to generate Appendix 4—figure 1.
- https://cdn.elifesciences.org/articles/83769/elife-83769-app4-fig1-data3-v2.zip
-
Appendix 4—figure 1—source data 4
The number of hotspots (), average population fitness (), and diversity at the PRDM9 locus () per generation, across 500,000 simulated generations of the two-heat model with a small population size () and strong hotspots (), and a smaller number of expressed PRDM9 molecules ().
This data was used to generate Appendix 4—figure 1.
- https://cdn.elifesciences.org/articles/83769/elife-83769-app4-fig1-data4-v2.zip
The effects of PRDM9 expression level on key quantities can be largely understood in terms of its effect on the optimal number of hotspots (Appendix 4—figure 2), which decreases with PRDM9 expression level ( in both homozygotes and heterozygotes. Specifically, the optimal number in homozygotes approaches as the heat of hotspots increases, or equivalently, as approaches zero (see Appendix 4—figure 2A). Consequently, invading PRDM9 alleles have fewer hotspots when PRDM9 expression is lower (Appendix 4—figure 2B). By the same token, established PRDM9 alleles become susceptible to invasion, and thus exit the population with fewer hotspots, when PRDM9 expression is lower (Appendix 4—figure 2B).
The effect of PRDM9 expression level on turnover time is mediated by the changes to the number of hotspots of invading and exiting PRDM9 alleles, with the effect approximately canceling out in the case of weak hotspots () and resulting in a slight increase with increased expression level in the case of strong hotspots () (Appendix 4—figure 2C). In principle, we would expect diversity levels to increase when the turnover time decreases, which is not what we observe (Appendix 4—figure 2C, D). Instead, we observe an increase in diversity with expression, as a consequence of having the number of hotspots of newly arising PRDM9 alleles drawn from a uniform distribution between 1 and 5,000. Namely, lower expression levels lead to a lower number of hotspots associated with the PRDM9 alleles capable of invading, which results in an effectively lower mutation rate at PRDM9 and thus in lower diversity levels.
Appendix 4—figure 2
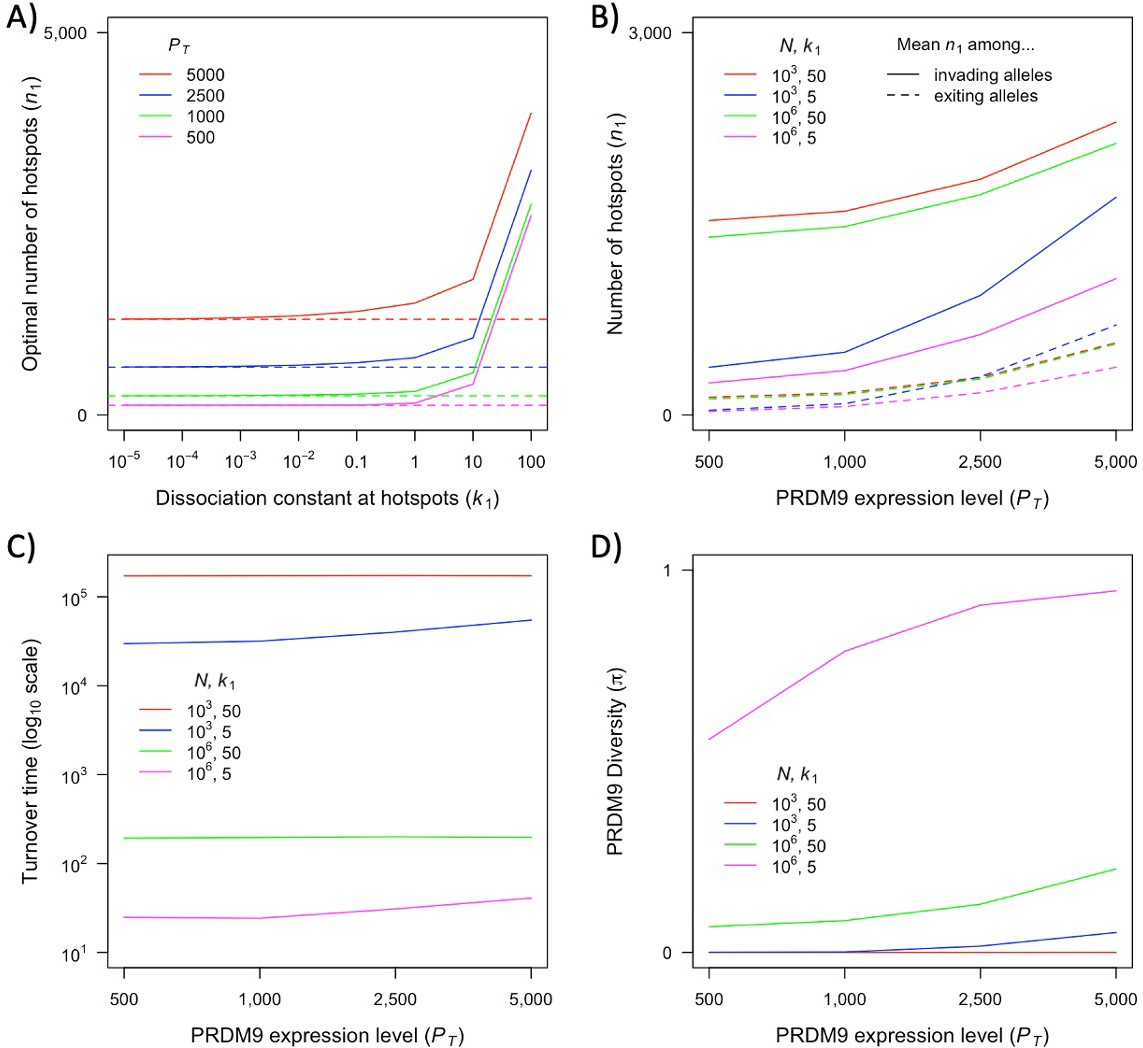
The dependence of key quantities on PRDM9 expression level.
(A) The number of hotspots which optimizes fitness for an individual homozygous for PRDM9 alleles as a function of the dissociation constant at hotspots () for different levels of PRDM9 expression (). Horizontal dashed lines indicate the expected optimal values as approaches zero (). (B) Mean number of hotspots among incoming and exiting alleles in small or large population sizes (=103 or 106) and when hotspots are relatively strong or weak ( = 5 or 50), as a function of PRDM9 expression level (). (C) Average turnover time of segregating PRDM9 alleles for different parameters as a function of PRDM9 expression level (). (D) Mean diversity at PRDM9 over time for different parameters as a function of PRDM9 expression level (). The weighting of PRDM9 alleles in B and C is as detailed in the main text. This figure was generated using Appendix 4—figure 2—source data 1.
-
Appendix 4—figure 2—source data 1
Summary statistics from simulations for large and small population sizes ( or 106) and for small and large hotspot dissociation constants ( or 50), for a range of values of the expression level of PRDM9 ( or 5000), including mean turnover times, mean initial numbers of hotspots, and mean number of hotspots for exiting PRDM9 alleles (each weighted by the sojourn time of PRDM9 alleles), as well as the mean and interquartile range of diversity at PRDM9 (). This data was used to generate Appendix 4—figure 2.
- https://cdn.elifesciences.org/articles/83769/elife-83769-app4-fig2-data1-v2.zip
Appendix 5
The effect of the distribution of the initial number of hotspots
When we analyzed the dynamics of the ‘two-heat model’ in the main text, we assumed that the number of hotspots associated with new PRDM9 alleles are drawn from a uniform distribution across a wide range (), which spans the optimal values for both homozygotes and heterozygotes across the considered range of hotspot strengths (). Our rationale was that under this assumption, the number of hotspots of PRDM9 alleles that persist and sometimes fix in the population will reflect the evolutionary dynamics rather than the properties of the mutational distribution. An alternative assumption, which is at the other extreme, would be to have the initial number of hotspots tightly distributed around a specific number of binding sites, namely one that arises from the specificity of a typical PRDM9 ZF array. Here, we briefly explore how making this alternative assumption would affect the dynamics.
We consider two such cases of ‘tight’ distributions, based on a rough approximation to the number of binding sites that perfectly matches the binding motif of a PRDM9 ZF array with and 11 non-degenerate base pairs. To this end, we assume a diploid genome of size of Gbp in which the nucleotide at each position is equally likely to be G, C, T and A. Under these assumptions, we would expect the number of hotspots associated with a new PRDM9 allele, , to be Binomially distributed with . With the distribution has mean ~3,338 and SD ~58, and with it has mean ~834 and SD ~29.
The evolutionary dynamics in these cases strongly depend on whether individuals that are homozygote or heterozygote for the initial number of hotspots have higher fitness. First, we consider the case with and mean ~3338,, in which the homozygotes have higher fitness throughout the range of hotspot strengths considered (Figure 3). This fact alone implies a cycling dynamic: a PRDM9 allele that invades is expected to fix because of the higher fitness in homozygotes, and to lose hotspots until it is invaded by the next allele. This is indeed what we observe in all cases (Appendix 5—figure 1). The higher fitness of new alleles in homozygotes precludes the ‘fixed point’ behaviors (Figure 3B) that give rise to highly polymorphic steady states or lead to a chaotic dynamic in the cases considered in the main text (Figure 4C and D, respectively). Instead, the dynamics we observe here are similar to what we see in the main text for weak hotspots (), because in that case, selection favored new PRDM9 alleles with ~2,000 hotspots (Figures 5 and 6A), which have higher fitness in homozygotes than in homozygotes (compare Figure 4A and B with Appendix 5—figure 1A, B).
Appendix 5—figure 1
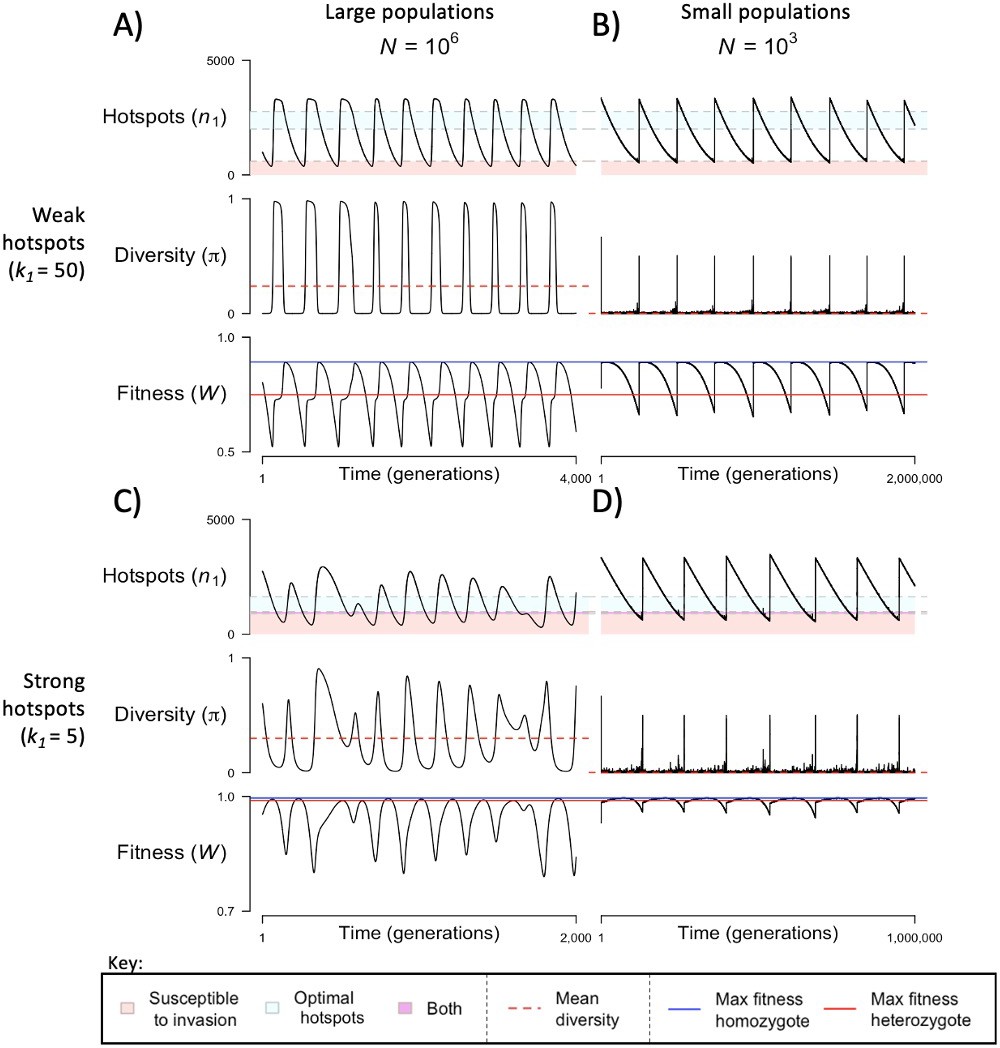
Dynamics of the two-heat model when the distribution of the initial numbers arises from a motif with 10 non-degenerate sites.
The mean number of hotspots (), diversity at PRDM9 (), and mean fitness (), as a function of time. We show four cases: with weak and strong hotspots (top and bottom rows respectively) and large and small population size (left and right column respectively). See Figure 4 and Appendix 5 for details. This figure was generated using Appendix 5—figure 1—source data 1–4.
-
Appendix 5—figure 1—source data 1
The number of hotspots (), average population fitness (), and diversity at the PRDM9 locus (pi) per generation, across 4,000 simulated generations of the two-heat model with a large population size () and weak hotspots (), when the distribution of the initial numbers arises from a motif with 10 non-degenerate sites.
This data was used to generate Appendix 5—figure 1.
- https://cdn.elifesciences.org/articles/83769/elife-83769-app5-fig1-data1-v2.zip
-
Appendix 5—figure 1—source data 2
The number of hotspots (), average population fitness (), and diversity at the PRDM9 locus () per generation, across 2,000,000 simulated generations of the two-heat model with a small population size () and weak hotspots (), when the distribution of the initial numbers arises from a motif with 10 non-degenerate sites.
This data was used to generate Appendix 5—figure 1.
- https://cdn.elifesciences.org/articles/83769/elife-83769-app5-fig1-data2-v2.zip
-
Appendix 5—figure 1—source data 3
The number of hotspots (), average population fitness (), and diversity at the PRDM9 locus () per generation, across 2,000 simulated generations of the two-heat model with a large population size () and strong hotspots (), when the distribution of the initial numbers arises from a motif with 10 non-degenerate sites.
This data was used to generate Appendix 5—figure 1.
- https://cdn.elifesciences.org/articles/83769/elife-83769-app5-fig1-data3-v2.zip
-
Appendix 5—figure 1—source data 4
The number of hotspots (), average population fitness (), and diversity at the PRDM9 locus () per generation, across 1,000,000 simulated generations of the two-heat model with a small population size () and strong hotspots (), when the distribution of the initial numbers arises from a motif with 10 non-degenerate sites.
This data was used to generate Appendix 5—figure 1.
- https://cdn.elifesciences.org/articles/83769/elife-83769-app5-fig1-data4-v2.zip
Next, we consider the case with and a mean of ~834 hotspots associated with new PRDM9 alleles. When hotspots are weak , homozygotes for new PRDM9 alleles have higher fitness than heterozygotes (Figure 3A). Consequently, we observe cycling dynamics, but in this case the turnover time is reduced, because it takes the loss of fewer hotspots for an established PRDM9 allele to become susceptible to invasion (compare Figure 4A and B with Appendix 5—figure 2A, B). In large populations (), in which hotspots erode faster than in smaller populations (Equations 11 and 12), an invading PRDM9 alleles becomes susceptible to invasion and selected against before it can even fix, resulting in more erratic, rapid cycles and high diversity levels (Appendix 5—figure 2A). The dynamics in Appendix 5—figure 1C can be explained in similar terms.
When hotspots are strong (), heterozygotes for new PRDM9 alleles have higher fitness than homozygotes (Figure 3B). In large populations (), we observe the same fixed-point dynamic as reported in the main text: in that case, selection favored new PRDM9 alleles with ~1,070 hotspots (Figures 5 and 6A), which also have higher fitness in heterozygotes than in homozygotes (compare Figure 4C with Appendix 5—figure 2C). When the population size is small (), however, we do not observe the chaotic dynamics that we see in the main text (compare Figure 4D with Appendix 5—figure 2D). Here, new PRDM9 alleles never have a sufficient number of hotspots to allow them to persist and reach high frequencies in the population (and thus generate chaotic cycles). Instead, we observe a fixed-point dynamic that is similar to the dynamics in large populations, with new PRDM9 alleles constantly invading and exiting the population without reaching fixation, but in this case, the mutational input at PRDM9 is sufficiently low for there to be substantial stochastic variation in diversity levels (compare Appendix 5—figure 2C, D).
Appendix 5—figure 2
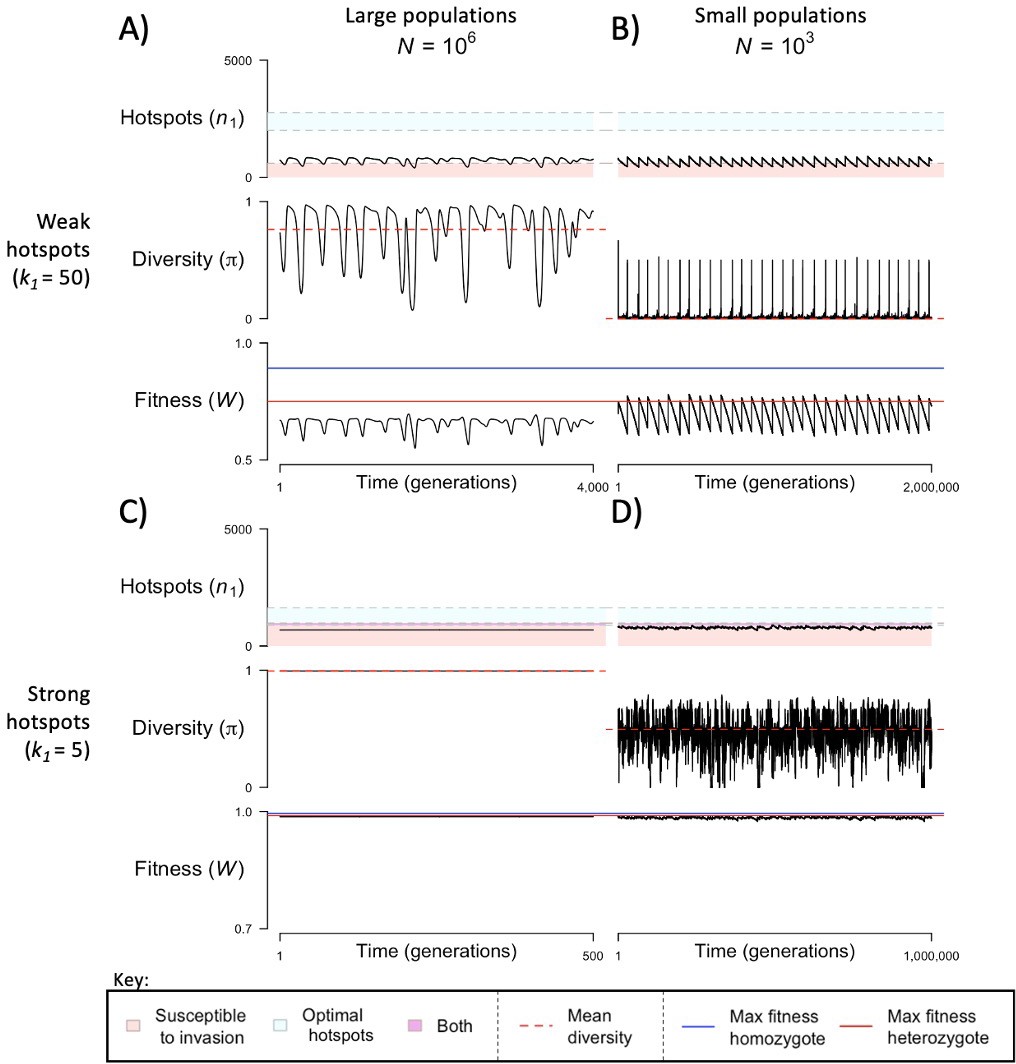
Dynamics of the two-heat model when the distribution of the initial numbers arises from a motif with 11 non-degenerate sites.
The mean number of hotspots (), diversity at PRDM9 (), and mean fitness (), as a function of time. We show four cases: with weak and strong hotspots (top and bottom rows respectively) and large and small population size (left and right column respectively). See Figure 4 and Appendix 5 for details. This figure was generated using Appendix 5—figure 2—source data 1–4.
-
Appendix 5—figure 2—source data 1
The number of hotspots (), average population fitness (), and diversity at the PRDM9 locus (pi) per generation, across 4,000 simulated generations of the two-heat model with a large population size () and weak hotspots (), when the distribution of the initial numbers arises from a motif with 11 non-degenerate sites.
This data was used to generate Appendix 5—figure 2.
- https://cdn.elifesciences.org/articles/83769/elife-83769-app5-fig2-data1-v2.zip
-
Appendix 5—figure 2—source data 2
The number of hotspots (), average population fitness (), and diversity at the PRDM9 locus () per generation, across 2,000,000 simulated generations of the two-heat model with a small population size () and weak hotspots (), when the distribution of the initial numbers arises from a motif with 11 non-degenerate sites.
This data was used to generate Appendix 5—figure 2.
- https://cdn.elifesciences.org/articles/83769/elife-83769-app5-fig2-data2-v2.zip
-
Appendix 5—figure 2—source data 3
The number of hotspots (), average population fitness (), and diversity at the PRDM9 locus () per generation, across 500 simulated generations of the two-heat model with a large population size () and strong hotspots (), when the distribution of the initial numbers arises from a motif with 11 non-degenerate sites.
This data was used to generate Appendix 5—figure 2.
- https://cdn.elifesciences.org/articles/83769/elife-83769-app5-fig2-data3-v2.zip
-
Appendix 5—figure 2—source data 4
The number of hotspots (), average population fitness (), and diversity at the PRDM9 locus () per generation, across 1,000,000 simulated generations of the two-heat model with a small population size () and strong hotspots (), when the distribution of the initial numbers arises from a motif with 11 non-degenerate sites.
This data was used to generate Appendix 5—figure 2.
- https://cdn.elifesciences.org/articles/83769/elife-83769-app5-fig2-data4-v2.zip
Data availability
All modeling code, as well as code used to generate the figures, is available at https://github.com/sellalab/PRDM9_model (copy archived at Sellalab, 2023). Source data files have been provided for Figures 2–6 and their associated figure supplements, as well as for the figures in Appendices 4–5.
References
-
Cataloging Human PRDM9 Allelic Variation Using Long-Read Sequencing Reveals PRDM9 Population Specificity and Two Distinct Groupings of Related AllelesFrontiers in Cell and Developmental Biology 9:675286.https://doi.org/10.3389/fcell.2021.675286
-
Fine-Scale Crossover Rate Variation on the Caenorhabditis elegans X ChromosomeG3: Genes, Genomes, Genetics 6:1767–1776.https://doi.org/10.1534/g3.116.028001
-
Altering the Binding Properties of PRDM9 Partially Restores Fertility across the Species BoundaryMolecular Biology and Evolution 38:5555–5562.https://doi.org/10.1093/molbev/msab269
-
Trimethylation of histone H3 lysine 36 by human methyltransferase PRDM9 proteinThe Journal of Biological Chemistry 289:12177–12188.https://doi.org/10.1074/jbc.M113.523183
-
Numerical constraints and feedback control of double-strand breaks in mouse meiosisGenes & Development 27:873–886.https://doi.org/10.1101/gad.213652.113
-
The Red Queen model of recombination hot-spot evolution: a theoretical investigationPhilosophical Transactions of the Royal Society of London. Series B, Biological Sciences 372:20160463.https://doi.org/10.1098/rstb.2016.0463
-
Evolution of the yeast recombination landscapeMolecular Biology and Evolution 36:412–422.https://doi.org/10.1093/molbev/msy233
-
Histone methyltransferase PRDM9 is not essential for meiosis in male miceGenome Research 29:1078–1086.https://doi.org/10.1101/gr.244426.118
-
PRDM9 interactions with other proteins provide a link between recombination hotspots and the chromosomal axis in meiosisMolecular Biology of the Cell 28:488–499.https://doi.org/10.1091/mbc.E16-09-0686
-
The time scale of recombination rate evolution in great apesMolecular Biology and Evolution 33:928–945.https://doi.org/10.1093/molbev/msv331
-
Hotspots for Initiation of Meiotic RecombinationFrontiers in Genetics 9:521.https://doi.org/10.3389/fgene.2018.00521
-
The Red Queen theory of recombination hotspotsJournal of Evolutionary Biology 24:541–553.https://doi.org/10.1111/j.1420-9101.2010.02187.x
-
PRDM9 and the evolution of recombination hotspotsTheoretical Population Biology 126:19–32.https://doi.org/10.1016/j.tpb.2018.12.005
-
Epigenetic control of meiotic recombination in plantsScience China. Life Sciences 58:223–231.https://doi.org/10.1007/s11427-015-4811-x
Decision letter
-
Bernard de MassyReviewing Editor; CNRS UM, France
-
Detlef WeigelSenior Editor; Max Planck Institute for Biology Tübingen, Germany
-
Bernard de MassyReviewer; CNRS UM, France
-
Sylvain GléminReviewer; Université Rennes 1, CNRS, France
Our editorial process produces two outputs: (i) public reviews designed to be posted alongside the preprint for the benefit of readers; (ii) feedback on the manuscript for the authors, including requests for revisions, shown below. We also include an acceptance summary that explains what the editors found interesting or important about the work.
Decision letter after peer review:
Thank you for submitting your article "Down the Penrose stairs: How selection for fewer recombination hotspots maintains their existence" for consideration by eLife. Your article has been reviewed by 3 peer reviewers, including Bernard de Massy as the Reviewing Editor and Reviewer #1, and the evaluation has been overseen by Jessica Tyler as the Senior Editor. The following individual involved in the review of your submission has agreed to reveal their identity: Sylvain Glemin (Reviewer #2).
The reviewers have discussed their reviews with one another, and the Reviewing Editor has drafted this to help you prepare a revised submission.
Essential revisions:
1) Introduction could be reduced.
2) The objective of each step of the model is not clearly explained and it is left to the reader to understand where the authors want to go. At first read, it is not clear whether the authors present an analysis of the model or simulation results and why they do that. So, the results part deserves rewriting and re-organization to guide the reader.
3) The choice of key parameters is justified except for Prdm9 occupancy, and potential competition between different Prdm9 variants for DSB activity.
4) Developing the specific predictions relative to previous red-queen models, for Prdm9 diversity in human and mice, for gene dosage effects reported in mice.
5) Some more explanation about the difference between the Penrose stair and the Red-queen.
6) Several clarifications on the data presented in the figures are also required.
Reviewer #1 (Recommendations for the authors):
A few specific points also require clarification:
1) In the model, the question of competition is not entirely clear.
There may be different levels of competition:
– Competition for binding of Prdm9 to its sites (this will depend on affinity and protein level);
Figure 1A indicates that Prdm9 binds its target as a consequence of competition between sites. It is not very clear what this means. Prdm9 will bind and occupy high-affinity sites more frequently than low-affinity sites. This is not a competition. There may be a competition but only if Prdm9 protein is limiting.
The authors write L215. "the corresponding PRDM9 binding sites will always be more likely to be bound in individuals homozygous for the cognate PRDM9 allele relative to heterozygotes": not if Prdm9 protein is not limiting.
In fact, by choosing conditions (L354) where 99% of Prdm9 is bound to weak sites in the absence of hotspots, it seems that the authors define conditions where Prdm9 is limiting. What is the rationale for this?
– Competition between Prdm9 bound and DSB activity (see Diagouraga et al., 2018) (if DSB activity is fixed, then the number of Prdm9 bound may exceed the number of potential DSB, ie 300). This could result in competition between Prdm9 alleles in heterozygotes.
2) Figure 1 represents kon and Koff; the text refers to Ki, thus, even if obvious, it should be mentioned that ki=koff/kon.
3) Figure 3B: the area shaded in red should correspond for the context where the homozygous have lower fitness that the maximal fitness of the heterozygous. Thus, what is the red-shaded area for > 4800 hotspots?
4) Figure 5: The label of the y-axis is missing, please clarify. It would help to describe the figure in the text (L480-484) as way more consistent with the figure itself, and to better explain how the data from Figure 4 was used to derive these hotspot distributions.
I assume the initial and final hotspots correspond to exiting and invading alleles? Is this correct?
"…the distribution is centered close to the optimal number of hotspots.", I guess the authors refer to the invading alleles distribution, please clarify in the text.
5) Estimation of the number of Prdm9 bound sites.
The authors use the value that has been published by Baker et al. Genome Res 24, 724-32 (2014). However, the problem is that this number is questionable.
Baker et al. indicated:
"…we estimated that there are;4700 +/- 400 PRDM9-modified sites in the B6 background in an average meiosis." "For estimating the total number of PRDM9-dependent hotspots per meiosis, an equal volume of MNase-digested input DNA was analyzed alongside the ChIP DNA".
This method is not correct: by using this Mnase-digested input DNA, the amount of DNA is likely underestimated, as most input DNA molecules are not bound by Prdm9, do not have positioned nucleosomes at Prdm9 binding sites, and thus not protected from Mnase (depending on the duration of treatment) as positioned nucleosomes are. This unknown underestimation factor means that the number of sites bound by Prdm9 is overestimated.
The way to address this issue is to design models with different values for pT (from 5000 to 500 for instance). Does it affect the simulations? How?
6) Connections with in vivo data should be made:
Several important studies in the analysis of Prdm9 hybrid incompatibility have reported dosage effects (ie Mihola et al. Science 323, 373-5 (2009); Flachs, P. et al. PLoS Genet 8, e1003044 (2012)).
These studies must be cited and discussed. Specifically, it is important to link the model presented to these studies, as they provide a potential assay to validate the model (in particular Flachs, P. et al. PLoS Genet 8, e1003044 (2012) where both the removal of an allele or increased gene dosage can improve the fertility of B6xSTUS hybrid). Although the in vivo parameters are not known in the hybrids that have been analyzed, the authors may be able to approximate some conditions that are simulated, and the model may propose an interpretation for these observations.
Also, the context of C57BL/6 mice seems a good example of a context where Prdm9 binding becomes limiting as seen in the B6 +/- mice (Baker, C.L. et al. Multimer Formation Explains Allelic Suppression of PRDM9 Recombination Hotspots. PLoS Genet 11, e1005512 (2015)). This seems to indicate that B6 sites have been strongly eroded.
In the discussion, the authors refer to the number of DSBs per meiosis (L701). If DSBs are indeed lower in B6 compared to PWD, it would suggest that the impact is global rather than specific to symmetric/asymmetric site balance (unless an additional hypothesis of co-evolution is invoked).
In addition to the reduction of DSB activity (at symmetric sites and maybe also at asymmetric sites), it has been shown in this context and other contexts (hybrids) that default sites are used. Even if not integrated into the model, this aspect should be discussed. At some point, during Prdm9 evolution, default sites are able to take over, thus this is a very important feature that needs to be taken into consideration/discussed, even if it does not directly impact the present study and model.
Reviewer #2 (Recommendations for the authors):
1) The introduction is a bit long but it is maybe necessary as the topic is complex. The authors did a very good job to explain such complexity but maybe so parts could be a bit reduced. For example, between l55-62 could be removed as it is not really discussed later on.
2) As explained above there are several points that should be clarified to help the reader
– In the two first results parts there is no direct result about the evolutionary dynamics per se but some logical predictions based on the fitness landscapes, similar to an invasion analysis (for example, under which conditions a new allele can invade? are there fixed points and which ones?). This step is fully justified but the objective should be explained clearly.
– In figures 2 and 3 it would be good to explain from which equations the figures come. For example, in figure 2 it is not clear whether it corresponds to fitness and probability of binding at an individual or population scale and what is the composition of the population.
– In figure 3 the composition of the population is not clear either: one resident PRDM9 allele? Several? So, "homozygote vs heterozygote genotypes" is not clear (as in Figure 3). We globally understand the rationale but then we need to guess to reconstruct the puzzle from the different pieces of equations.
– l. 310. "These last two assumptions are key, as can be understood by considering how fitness would change over time without them, under the simplest possible scenario, in which all individuals are homozygous for a single PRDM9 allele and all binding sites have the same binding affinity." This statement is rather implicit and the reader may think that the answer is in the sentence (however one must read the next paragraph to fully understand). Maybe rephrase a more explicit explanation.
– In the third part, mutations on PRDM9 are introduced but not before. This should be explained in the model part that the mutation dynamics of PRDM9 are not considered first for the fitness analysis. Otherwise, it leaves the reader with unanswered questions about it until l426. We also only understand when reading this part that the diversity of PRDM9 will be followed. So, this should be explained earlier also.
3) Choice of parameters
– The number of hotspots associated with a new PRDM9 allele is drawn in a uniform distribution between 1 and 5000. This is a bit surprising. Is there any justification for this choice? Instead, we might have expected a unimodal distribution centered for example on the average number of sequences we can find at random in a genome for a motif. A few additional simulations with another distribution could be helpful to check whether the results are not dependent too much on this assumption.
– It is also justified to explore only the case of two heats and the assumptions of many weak sites seem reasonable, but it is not justified. Is the underlying justification that for a given motif of k nucleotides there is 3^k possible one-step mutant motif (so many more) that should only bind weakly (because of one mutant site)? – Among other choices of parameters, the authors decided to consider only two heats (and discussed this choice). However, we can consider that there are only two heats per PRDM9 alleles but that they have different heats, especially the hottest one. If possible, a complementary set of simulations would be to fix n2 and k2 as the authors did but then instead of fixing k1 and considering that each new PRDM9 allele has a different n1, doing the reverse: fixing n1 and drawing k1 in a distribution.
4) Discussion
A possible suggestion would be to summarize observations to explain in a table in parallel with predictions of this model and those of previous red-queen models to clearly show what is better explained, what is not that different, and what could be tested further.
https://doi.org/10.7554/eLife.83769.sa1Author response
Essential revisions:
1) Introduction could be reduced.
We have shortened the introduction along the lines suggested by reviewers.
2) The objective of each step of the model is not clearly explained and it is left to the reader to understand where the authors want to go. At first read, it is not clear whether the authors present an analysis of the model or simulation results and why they do that. So, the results part deserves rewriting and re-organization to guide the reader.
We edited the Results section to make the progression of the argument clearer (as detailed below).
3) The choice of key parameters is justified except for Prdm9 occupancy, and potential competition between different Prdm9 variants for DSB activity.
We have now added a justification of these choices. We also added two appendixes that consider alternative assumptions, and parts that address specific assumptions, including those about competition, to the Discussion. We now clarify in the Model that our assumption about the vast majority of expressed PRDM9 molecules being bound results in negligible degrees of competition between different PRDM9 variants for DSB activity:
“This approximation assumes that conditional on being bound, PRDM9 molecules arising from different alleles are equally likely to recruit the DSB machinery, but allows for some degree of dominance as a consequence of differences in the numbers of sites bound by each allelic variant genome-wide. However, in the main case we explore below (the "two-heat model"), our assumption that the vast majority of PRDM9 molecules are bound for all alleles results in negligible degrees of dominance arising from differences in genome-wide levels of binding.”
4) Developing the specific predictions relative to previous red-queen models, for Prdm9 diversity in human and mice, for gene dosage effects reported in mice.
We chose the two-heat model as a reasonable first approximation to the true distribution. If we were to consider a more realistic binding distribution (or similarly, if we relaxed our assumption about most PRDM9 molecules being bound), the quantitative conclusions would likely be affected. Accordingly, while our simplified model provides robust insights into the dynamics of PRDM9 evolution, quantities such as the predicted levels of diversity in our model may be off and cannot be readily compared to what is observed in human and mice populations. We now better clarify the scope of our results and what may be done to extend it, in the Discussion.
Re. the second point, we now include a new section in the Discussion, entitled “PRDM9-mediated hybrid sterility” which discusses the reported gene dosage effects in mice.
5) Some more explanation about the difference between the Penrose stair and the Red-queen.
We have expanded our discussion of the Penrose stair model relative to the Red Queen model at the end of the Discussion section “Does the decay of hotspots by GC lead to more or fewer hotspots?” We now make clear that the Penrose stair model is not meant to replace the Red Queen model, but rather, suggests that which direction the Red Queen is running in – towards fewer or more hotspots – is a matter of perspective.
6) Several clarifications on the data presented in the figures are also required.
We clarified all the requested points and added a few others (as detailed below).
Reviewer #1 (Recommendations for the authors):
A few specific points also require clarification:
1) In the model, the question of competition is not entirely clear.
There may be different levels of competition:
– Competition for binding of Prdm9 to its sites (this will depend on affinity and protein level);
Figure 1A indicates that Prdm9 binds its target as a consequence of competition between sites. It is not very clear what this means. Prdm9 will bind and occupy high-affinity sites more frequently than low-affinity sites. This is not a competition. There may be a competition but only if Prdm9 protein is limiting.
We have changed the text of Figure 1A to read “PRDM9 binds its target sites at rates determined by Michaelis-Menton kinetics” instead of “as a consequence of competition between sites”. In this context, competition refers to the fact that the rate at which PRDM9 will bind and occupy high-affinity sites depends on the number of other sites and their particular affinities (i.e., that sites act as competitive inhibitors of one another). We now explicitly state our assumption that PRDM9 is limiting in the model overview.
The authors write L215. "the corresponding PRDM9 binding sites will always be more likely to be bound in individuals homozygous for the cognate PRDM9 allele relative to heterozygotes": not if Prdm9 protein is not limiting.
In fact, by choosing conditions (L354) where 99% of Prdm9 is bound to weak sites in the absence of hotspots, it seems that the authors define conditions where Prdm9 is limiting. What is the rationale for this?
In the context of Equation 1, for any finite and non-zero values of and , increasing the value of will increase the value of (the probability of a site being bound). We have added a paragraph at the end of the model section “Molecular dynamics of PRDM9 binding,” which clarifies that this increase will be small if PRDM9 is non-limiting: “The difference in the probability of binding the cognate PRDM9 in homozygotes and heterozygotes and the degree of competition among binding sites will be small when PRDM9 is not limiting (i.e., when ), but can be substantial when PRDM9 is limiting (i.e., when ).”
The primary reason for assuming that PRDM9 is limiting is because the gene dosage effects of PRDM9 observed in mice would not occur if PRDM9 expression were not limiting. We now make this point explicitly in the paragraph mentioned above: “Empirical observations suggest that PRDM9 is limiting, with given binding sites bound at substantially greater rates in homozygote individuals than in heterozygotes or hemizygotes (Flachs et al. 2012, Baker et al. 2015)”.
We further assumed that in order to simplify our analysis; as described in Appendix 3, so long as , we can reduce the number of parameters in our model by collapsing , and into a single parameter. We clarify this point in the Model section:“In the main case we study below (the “two-heat model”), we assume model parameter values for which the bulk of PRDM9 molecules are bound (i.e., ) and thus the competition among binding sites is strongest; this choice simplifies our analysis by reducing the number of parameters that affect the dynamics (see below).”
– Competition between Prdm9 bound and DSB activity (see Diagouraga et al., 2018) (if DSB activity is fixed, then the number of Prdm9 bound may exceed the number of potential DSB, ie 300). This could result in competition between Prdm9 alleles in heterozygotes.
This possibility was briefly mentioned in the Model section “Molecular dynamics of DSBs and symmetric DSBs”. We now underscore the fact that our assumption about most PRDM9 molecules being bound in the absence of hotspots results in negligible degrees of competition between PRDM9 variants for DSB activity there:
“This approximation assumes that conditional on being bound, PRDM9 molecules arising from different alleles are equally likely to recruit the DSB machinery, but allows for some degree of dominance as a consequence of differences in the numbers of sites bound by each allelic variant genome-wide. However, in the main case we explore below (the "two-heat model"), our assumption that the vast majority of PRDM9 molecules are bound for all alleles results in negligible degrees of dominance arising from differences in genome-wide levels of binding.”
2) Figure 1 represents kon and Koff; the text refers to Ki, thus, even if obvious, it should be mentioned that ki=koff/kon.
We now mention it in the text (“Molecular dynamics of PRDM9 binding”):
“where () is the site’s dissociation constant …”
3) Figure 3B: the area shaded in red should correspond for the context where the homozygous have lower fitness that the maximal fitness of the heterozygous. Thus, what is the red-shaded area for > 4800 hotspots?
Individuals homozygous for a PRDM9 allele with n1 hotspots can have reduced fitness relative to individual heterozygous for that allele and one with the optimal number of hotspots for heterozygotes when either: (a) is very small, such that an appreciable number of DSBs localize to weak binding sites, or (b) is very large, such that the degree of symmetry at any individual hotspot is reduced. The red-shaded area to the left corresponds to the former, and the red-shaded area to the right the latter. We now clarify this point in the figure legend: “In both panels, the region shaded in light red on the left reflects the case wherein the homozygous individual will have reduced fitness as a consequence of PRDM9 binding to weak binding sites. In panel B, the region on the right reflects the case wherein the homozygous individual will have reduced fitness as a consequence of limited symmetric binding at hotspots.”
4) Figure 5: The label of the y-axis is missing, please clarify. It would help to describe the figure in the text (L480-484) as way more consistent with the figure itself, and to better explain how the data from Figure 4 was used to derive these hotspot distributions.
We have added a y-axis label to Figure 5, which reads “Probability density”
I assume the initial and final hotspots correspond to exiting and invading alleles? Is this correct?
Yes. We now clarify this point in the Figure 5 figure caption, “The relative densities of initial and final numbers of hotspots (corresponding to invading and exiting alleles, respectively) …” and in the main text when introducing Figure 5 (see below).
"…the distribution is centered close to the optimal number of hotspots.", I guess the authors refer to the invading alleles distribution, please clarify in the text.
We now clarify this point in the text: “The distribution primarily reflects the number of hotspots of successfully invading alleles, and its mean is therefore near the optimal number of hotspots for heterozygotes…”
5) Estimation of the number of Prdm9 bound sites.
The authors use the value that has been published by Baker et al. Genome Res 24, 724-32 (2014). However, the problem is that this number is questionable.
Baker et al. indicated:
"…we estimated that there are;4700 +/- 400 PRDM9-modified sites in the B6 background in an average meiosis." "For estimating the total number of PRDM9-dependent hotspots per meiosis, an equal volume of MNase-digested input DNA was analyzed alongside the ChIP DNA".
This method is not correct: by using this Mnase-digested input DNA, the amount of DNA is likely underestimated, as most input DNA molecules are not bound by Prdm9, do not have positioned nucleosomes at Prdm9 binding sites, and thus not protected from Mnase (depending on the duration of treatment) as positioned nucleosomes are. This unknown underestimation factor means that the number of sites bound by Prdm9 is overestimated.
The way to address this issue is to design models with different values for pT (from 5000 to 500 for instance). Does it affect the simulations? How?
We thank the reviewer for the suggestion. We have run additional simulations (when considering strong and weak hotspots, = 5 or 50, and when considering large and small population sizes, ), using = 500, 1000 and 2500. The results of these simulations are included and discussed in Appendix 4. We show in Appendix 4 Figure 1 that changing the value of results in minimal changes to the qualitative dynamics of our model. The quantitative changes to the model are shown in Appendix 4 Figure 2.
6) Connections with in vivo data should be made:
Several important studies in the analysis of Prdm9 hybrid incompatibility have reported dosage effects (ie Mihola et al. Science 323, 373-5 (2009); Flachs, P. et al. PLoS Genet 8, e1003044 (2012)).
These studies must be cited and discussed. Specifically, it is important to link the model presented to these studies, as they provide a potential assay to validate the model (in particular Flachs, P. et al. PLoS Genet 8, e1003044 (2012) where both the removal of an allele or increased gene dosage can improve the fertility of B6xSTUS hybrid). Although the in vivo parameters are not known in the hybrids that have been analyzed, the authors may be able to approximate some conditions that are simulated, and the model may propose an interpretation for these observations.
We are grateful for the suggestion, as we believe that this study is a nice example of where our model can explain results in a manner that previous models could not. Specifically, we now include an explanation of the observed gene dosage effects in mice in the Discussion section: “PRDM9-mediated hybrid sterility”.
Also, the context of C57BL/6 mice seems a good example of a context where Prdm9 binding becomes limiting as seen in the B6 +/- mice (Baker, C.L. et al. Multimer Formation Explains Allelic Suppression of PRDM9 Recombination Hotspots. PLoS Genet 11, e1005512 (2015)). This seems to indicate that B6 sites have been strongly eroded.
We now include this reference in support of the notion that PRDM9 is limiting:
“Empirical observations suggest that PRDM9 is limiting, with given binding sites bound at substantially greater rates in homozygote individuals than in heterozygotes or hemizygotes (Flachs et al. 2012, Baker et al. 2015)”.
In the discussion, the authors refer to the number of DSBs per meiosis (L701). If DSBs are indeed lower in B6 compared to PWD, it would suggest that the impact is global rather than specific to symmetric/asymmetric site balance (unless an additional hypothesis of co-evolution is invoked).
In addition to the reduction of DSB activity (at symmetric sites and maybe also at asymmetric sites), it has been shown in this context and other contexts (hybrids) that default sites are used. Even if not integrated into the model, this aspect should be discussed. At some point, during Prdm9 evolution, default sites are able to take over, thus this is a very important feature that needs to be taken into consideration/discussed, even if it does not directly impact the present study and model.
Thank you for your suggestions. We now explicitly mention in the Discussion section “Why use PRDM9?” that the use of default sites is also seen in hybrid mice: “In vertebrate lineages in which PRDM9 has been lost, such as canids, birds or percomorph fish, as well as in PRDM9 knockout mice and rats, and to a much lesser degree in sterile mice hybrids, recombination events are concentrated in hotspots that tend to be found associated with promoter-like features…”
In that section, we have expanded our discussion regarding why PRDM9 may have been lost in favor of the use of ‘default’ hotspots.
Reviewer #2 (Recommendations for the authors):
1) The introduction is a bit long but it is maybe necessary as the topic is complex. The authors did a very good job to explain such complexity but maybe so parts could be a bit reduced. For example, between l55-62 could be removed as it is not really discussed later on.
Following this suggestion and that of reviewer 1, we have shortened the introduction.
2) As explained above there are several points that should be clarified to help the reader
– In the two first results parts there is no direct result about the evolutionary dynamics per se but some logical predictions based on the fitness landscapes, similar to an invasion analysis (for example, under which conditions a new allele can invade? are there fixed points and which ones?). This step is fully justified but the objective should be explained clearly.
We edited the Results section to make the progression of the argument clearer.
– In figures 2 and 3 it would be good to explain from which equations the figures come. For example, in figure 2 it is not clear whether it corresponds to fitness and probability of binding at an individual or population scale and what is the composition of the population.
– In figure 3 the composition of the population is not clear either: one resident PRDM9 allele? Several? So, "homozygote vs heterozygote genotypes" is not clear (as in Figure 3). We globally understand the rationale but then we need to guess to reconstruct the puzzle from the different pieces of equations.
We now clarify in the Figure 2 caption that we are “assuming that all individuals are homozygous for a single PRDM9 allele (without turnover)” and thus that the value is the same on the individual or population scale. In the caption of Figure 3, we now clarify that we are showing results “for an individual homozygous for a PRDM9 allele (blue), or heterozygous for two PRDM9 alleles with the same number of hotspots (red)…”
– l. 310. "These last two assumptions are key, as can be understood by considering how fitness would change over time without them, under the simplest possible scenario, in which all individuals are homozygous for a single PRDM9 allele and all binding sites have the same binding affinity." This statement is rather implicit and the reader may think that the answer is in the sentence (however one must read the next paragraph to fully understand). Maybe rephrase a more explicit explanation.
We have re-written this sentence to signpost that we are providing an answer later in the text. It now reads: “In order to illustrate the importance of these assumptions, we first consider how fitness would change over time with or without these assumptions, under the simplest possible scenario, in which all individuals are homozygous for a single PRDM9 allele and all binding sites have the same binding affinity”
– In the third part, mutations on PRDM9 are introduced but not before. This should be explained in the model part that the mutation dynamics of PRDM9 are not considered first for the fitness analysis. Otherwise, it leaves the reader with unanswered questions about it until l426. We also only understand when reading this part that the diversity of PRDM9 will be followed. So, this should be explained earlier also.
We now make it explicit in the second Results section that we are not considering the evolutionary dynamics there, but that they are presented below: “At this point, we do not yet consider the evolutionary dynamics, but gain insights helpful to elucidating these dynamics below.”
3) Choice of parameters
– The number of hotspots associated with a new PRDM9 allele is drawn in a uniform distribution between 1 and 5000. This is a bit surprising. Is there any justification for this choice? Instead, we might have expected a unimodal distribution centered for example on the average number of sequences we can find at random in a genome for a motif. A few additional simulations with another distribution could be helpful to check whether the results are not dependent too much on this assumption.
Thank you for your suggestion. We have now added an additional appendix (Appendix 5), which investigates the dynamics of our model when newly arising PRDM9 alleles are initiated with hotspot numbers set near values that would be reasonable for perfect matches to motifs with 10 or 11 non-degenerate bases. We show that this sometimes affects the dynamics (compared to the case in the main text), but when it does, the differences can be readily understood using the same kind of reasoning developed in the main text.
– It is also justified to explore only the case of two heats and the assumptions of many weak sites seem reasonable, but it is not justified. Is the underlying justification that for a given motif of k nucleotides there is 3^k possible one-step mutant motif (so many more) that should only bind weakly (because of one mutant site)?
When the two-heat model is first introduced, it is motivated by being more realistic than the single-heat model (see last paragraph of the section, “Fitness in models with one heat”). The qualifications of its reality are introduced in several following steps. First, in the section "Dynamics of the two-heat model", we point to the two extensions explored in the new Appendices, including one that is based on the model that the reviewer alludes to. Then, in the discussion, we explicitly consider the assumption of two heats compared to a more realistic distribution, as well as the assumption about most PRDM9 molecules being bound. We think that this gradual elaboration is better than trying to 'over-justify' the two-heat model off the bat.
– Among other choices of parameters, the authors decided to consider only two heats (and discussed this choice). However, we can consider that there are only two heats per PRDM9 alleles but that they have different heats, especially the hottest one. If possible, a complementary set of simulations would be to fix n2 and k2 as the authors did but then instead of fixing k1 and considering that each new PRDM9 allele has a different n1, doing the reverse: fixing n1 and drawing k1 in a distribution.
We agree with the reviewer that there are many more variations of the model that could be considered. To that end, we also provide documented code for all our results, making it as easy as possible for other investigators to explore variations on our assumptions. We chose to limit our scope to what we see as the simplest kind of model that captures many of the essential parts that affect PRDM9 evolution.
With regards to the reviewer’s specific suggestion, given two PRDM9 alleles with the same number of hotspots, the one whose hotspots are hotter will always have a higher marginal/allelic fitness, because a greater proportion of PRDM9 will be found bound to hotspots, as opposed to weak binding sites. Accordingly, selection will always favor lower values of . This behavior is illustrated in Figure 6D.
4) Discussion
A possible suggestion would be to summarize observations to explain in a table in parallel with predictions of this model and those of previous red-queen models to clearly show what is better explained, what is not that different, and what could be tested further.
While our simplified model provides robust insights into the dynamics of PRDM9 evolution, quantities such as the predicted levels of diversity in our model may be off and cannot be readily compared to what is observed in human and mice populations. We now better clarify the scope of our results and what may be done to extend it, in the Discussion.
https://doi.org/10.7554/eLife.83769.sa2Article and author information
Author details
Funding
National Institutes of Health (R01 GM83098)
- Molly Przeworski
National Institutes of Health (R01 GM115889)
- Guy Sella
The funders had no role in study design, data collection and interpretation, or the decision to submit the work for publication.
Acknowledgements
We thank Nicolas Lartillot, Laurent Duret, Scott Keeney, and members of the Przeworski and Sella labs for helpful discussions, as well as our reviewers, including Bernard de Massy and Sylvain Glemin, for their useful comments. This work was supported by NIH grant R01 GM83098 to MP and NIH R01 GM115889 to GS.
Senior Editor
- Detlef Weigel, Max Planck Institute for Biology Tübingen, Germany
Reviewing Editor
- Bernard de Massy, CNRS UM, France
Reviewers
- Bernard de Massy, CNRS UM, France
- Sylvain Glémin, Université Rennes 1, CNRS, France
Version history
- Preprint posted: September 28, 2022 (view preprint)
- Received: September 28, 2022
- Accepted: October 12, 2023
- Accepted Manuscript published: October 13, 2023 (version 1)
- Version of Record published: December 6, 2023 (version 2)
Copyright
© 2023, Baker et al.
This article is distributed under the terms of the Creative Commons Attribution License, which permits unrestricted use and redistribution provided that the original author and source are credited.
Metrics
-
- 409
- Page views
-
- 93
- Downloads
-
- 1
- Citations
Article citation count generated by polling the highest count across the following sources: Crossref, PubMed Central, Scopus.
Download links
A two-part list of links to download the article, or parts of the article, in various formats.
Downloads (link to download the article as PDF)
Open citations (links to open the citations from this article in various online reference manager services)
Cite this article (links to download the citations from this article in formats compatible with various reference manager tools)
Down the Penrose stairs, or how selection for fewer recombination hotspots maintains their existence
eLife 12:e83769.
https://doi.org/10.7554/eLife.83769
Further reading
-
- Evolutionary Biology
- Genetics and Genomics
Microbial plankton play a central role in marine biogeochemical cycles, but the timing in which abundant lineages diversified into ocean environments remains unclear. Here, we reconstructed the timeline in which major clades of bacteria and archaea colonized the ocean using a high-resolution benchmarked phylogenetic tree that allows for simultaneous and direct comparison of the ages of multiple divergent lineages. Our findings show that the diversification of the most prevalent marine clades spans throughout a period of 2.2 Ga, with most clades colonizing the ocean during the last 800 million years. The oldest clades – SAR202, SAR324, Ca. Marinimicrobia, and Marine Group II – diversified around the time of the Great Oxidation Event, during which oxygen concentration increased but remained at microaerophilic levels throughout the Mid-Proterozoic, consistent with the prevalence of some clades within these groups in oxygen minimum zones today. We found the diversification of the prevalent heterotrophic marine clades SAR11, SAR116, SAR92, SAR86, and Roseobacter as well as the Marine Group I to occur near to the Neoproterozoic Oxygenation Event (0.8–0.4 Ga). The diversification of these clades is concomitant with an overall increase of oxygen and nutrients in the ocean at this time, as well as the diversification of eukaryotic algae, consistent with the previous hypothesis that the diversification of heterotrophic bacteria is linked to the emergence of large eukaryotic phytoplankton. The youngest clades correspond to the widespread phototrophic clades Prochlorococcus, Synechococcus, and Crocosphaera, whose diversification happened after the Phanerozoic Oxidation Event (0.45–0.4 Ga), in which oxygen concentrations had already reached their modern levels in the atmosphere and the ocean. Our work clarifies the timing at which abundant lineages of bacteria and archaea colonized the ocean, thereby providing key insights into the evolutionary history of lineages that comprise the majority of prokaryotic biomass in the modern ocean.
-
- Evolutionary Biology
- Microbiology and Infectious Disease
Drug resistance remains a major obstacle to malaria control and eradication efforts, necessitating the development of novel therapeutic strategies to treat this disease. Drug combinations based on collateral sensitivity, wherein resistance to one drug causes increased sensitivity to the partner drug, have been proposed as an evolutionary strategy to suppress the emergence of resistance in pathogen populations. In this study, we explore collateral sensitivity between compounds targeting the Plasmodium dihydroorotate dehydrogenase (DHODH). We profiled the cross-resistance and collateral sensitivity phenotypes of several DHODH mutant lines to a diverse panel of DHODH inhibitors. We focus on one compound, TCMDC-125334, which was active against all mutant lines tested, including the DHODH C276Y line, which arose in selections with the clinical candidate DSM265. In six selections with TCMDC-125334, the most common mechanism of resistance to this compound was copy number variation of the dhodh locus, although we did identify one mutation, DHODH I263S, which conferred resistance to TCMDC-125334 but not DSM265. We found that selection of the DHODH C276Y mutant with TCMDC-125334 yielded additional genetic changes in the dhodh locus. These double mutant parasites exhibited decreased sensitivity to TCMDC-125334 and were highly resistant to DSM265. Finally, we tested whether collateral sensitivity could be exploited to suppress the emergence of resistance in the context of combination treatment by exposing wildtype parasites to both DSM265 and TCMDC-125334 simultaneously. This selected for parasites with a DHODH V532A mutation which were cross-resistant to both compounds and were as fit as the wildtype parent in vitro. The emergence of these cross-resistant, evolutionarily fit parasites highlights the mutational flexibility of the DHODH enzyme.


